Archive for June 2012

BgInfo

Information

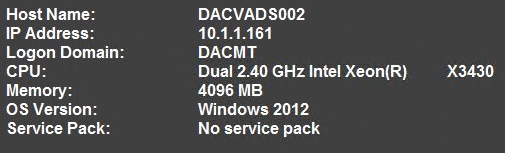
How many times have you walked up to a system in your office and needed to click through several diagnostic windows to remind yourself of important aspects of its configuration, such as its name, IP address, or operating system version? If you manage multiple computers you probably need BGInfo. It automatically displays relevant information about a Windows computer on the desktop’s background, such as the computer name, IP address, service pack version, and more. You can edit any field as well as the font and background colors, and can place it in your startup folder so that it runs every boot, or even configure it to display as the background for the logon screen.

Because BGInfo simply writes a new desktop bitmap and exits, you don’t have to worry about it consuming system resources or interfering with other applications.

Installation and Configuration

  • Download BGInfo.exe It will appear as a zip file.
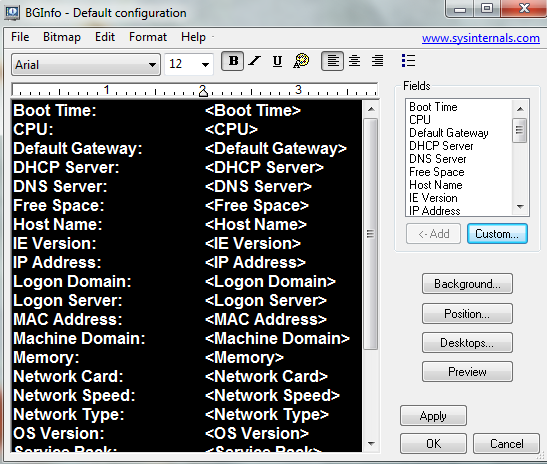
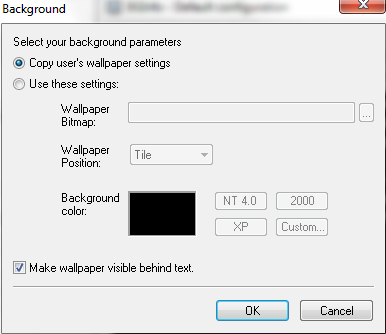
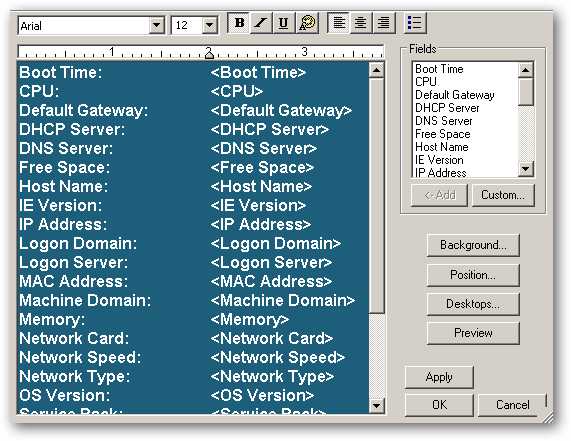
  • When you execute BGInfo for the first time, it displays the Default configuration window.
  • Note: The tool automatically applies this configuration after 10 seconds unless you click somewhere in this window. Selecting any button or menu item will disable the timer, allowing you to customize the layout and content of the background information.
  • To uninstall, delete BGINFO.EXE and reset your system’s wallpaper using Windows’ Desktop Properties dialog.

bginfo

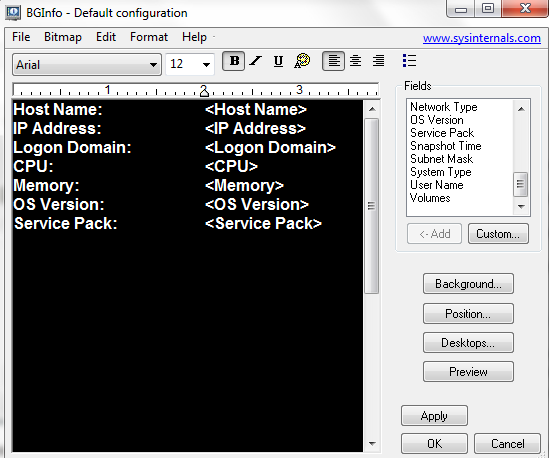
  • You can simply delete the lines you don’t want and add the ones you do

bginfo4

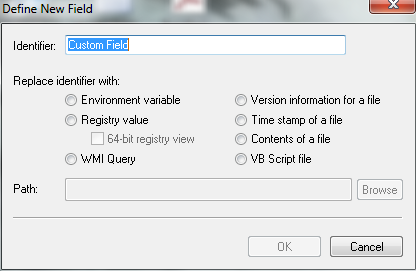
  • Click Custom to add User Defined fields

bginfo2

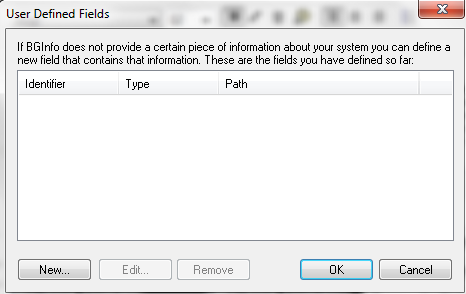
  • These can be any of the following

bginfo3

  • Click Background

bginfo5

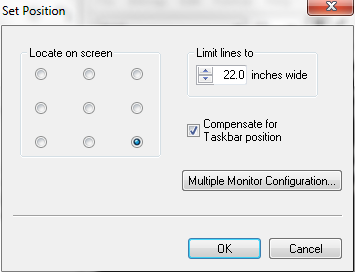
  • Click Position and choose where you want to see the information on your screen

bginfo6

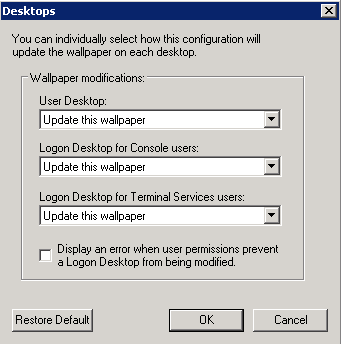
  • Click on Desktops. Selects which desktops are updated when the configuration is applied. By default only the User Desktop wallpaper is changed. Enabling the Logon Desktop for Console users option specifies that the wallpaper should be displayed on the logon desktop that is presented before anyone has logged onto the system. On Windows 95/98/ME systems the same desktop is used for users and the login screen, so this option has no effect. Enabling the Logon Desktop for Terminal Services users option specifies that the wallpaper should be displayed on the Terminal Services login screen. This option is useful only on servers running Terminal Services.

bginfo26

  • Clicking Preview will allow you to see what your configuration looks like so far. Clicking Preview again will exit the Preview Screen
  • Using the icons on the top toolbar allow you to change the font, font colour, font size, boldness, underline and italic etc

bginfo8

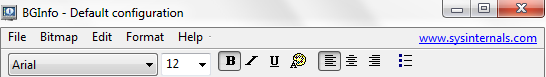
  • Clicking on File brings up the following options

  • File | Open: Opens a BGInfo configuration file.
  • File | Save As: Saves a copy of the current BGInfo configuration to a new file. Once created, you can have BGInfo use the file later by simply specifying it on the command line, or by using File|Open menu option.
  • File | Reset Default Settings: Removes all configuration information and resets BGInfo to its default (install-time) state. Use this if you can’t determine how to undo a change, or if BGInfo becomes confused about the current state of the bitmap.
  • File | Database: Specifies a .XLS, .MDB or .TXT file or a connection string to an SQL database that BGInfo should use to store the information it generates. Use this to collect a history of one or more systems on your network.  You must ensure that all systems that access the file have the same version of MDAC and JET database support installed. It is recommended you use at least MDAC 2.5 and JET 4.0.  If specifying an XLS file the file must already exist
  • So now once you are happy with your configuration, you now need to save it for example as BGInfoCapture.bgi

Deploying to Client Machines

  • Deployment to the respective client machines is pretty straightforward. No installation is required
  • You just need to copy the BGInfo.exe and the BGInfoCapture.bgi to each machine and place them in the same directory.
  • Once in place, open cmd.exe and just run the command:

bginfo9

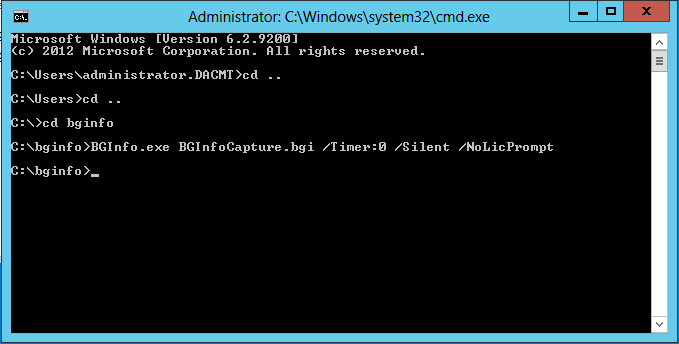
  • The first part runs BGInfo, the second specifies the config file to use, and the final part tells it to run immediately and not display the configuration screen.
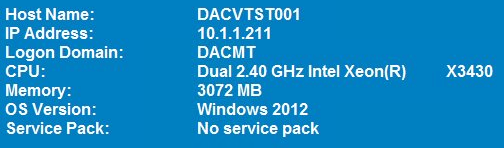
  • And Voila, you now see what happens

bginfo10

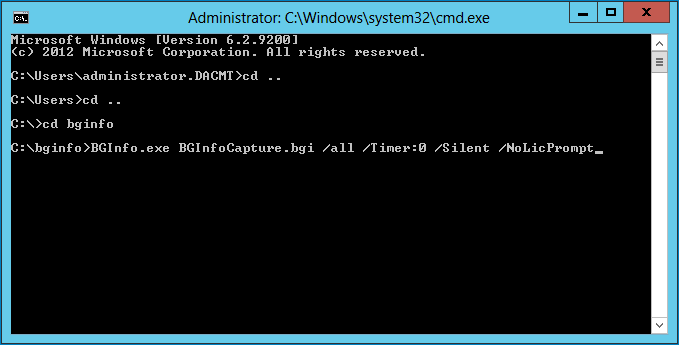
  • If you specify the /all switch, this specifies that BGInfo should change the wallpaper for any and all users currently logged in to the system. This option is useful within a Terminal Services session

bginfo11

Creating a scheduled Task

Of course, you probably want to schedule the capture process to run on a schedule. This command creates a Scheduled Task to run the capture process at 8 AM every morning and assumes you copied the required files to the root of your C drive

SCHTASKS /Create /SC DAILY /ST 08:00 /TN “System Info” /TR “C:\BGInfo.exe C:\BGInfoCapture.bgi /Timer:0 /Silent /NoLicPrompt”

How to Deploy BGInfo using a GPO

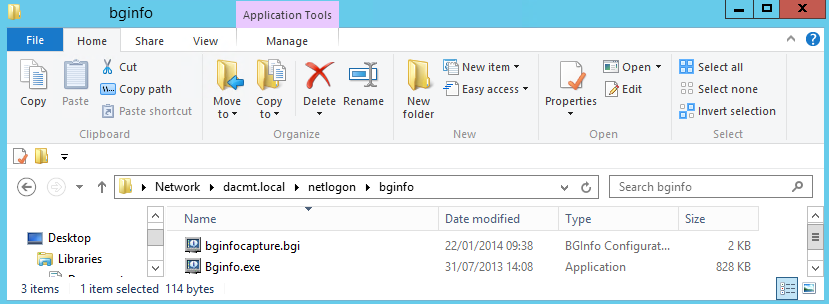
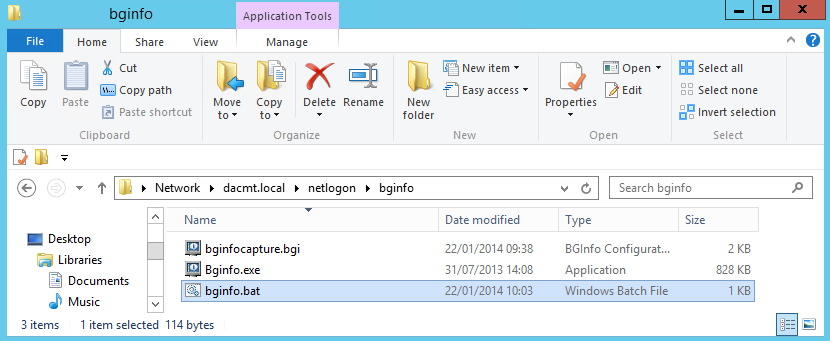
  • First of all copy your bginfo.exe file and your bginfocapture.bgi configuration file into an accessible share. I am going to use my \\dacmt.local\netlogon share

bginfo18

  • Next we need to write a short bat file

bginfo17

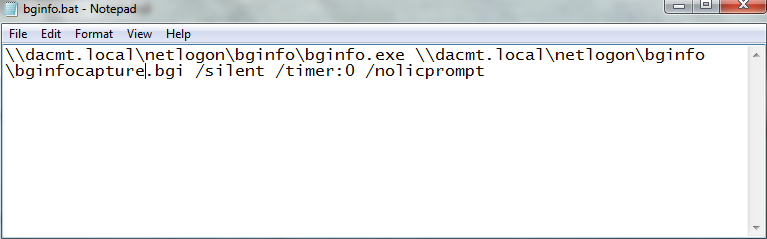
  • Save this bginfo.bat file into the same shared folder as your bginfo.exe and bginfocapture.bgi config file

bginfo19

  • Log into your Active Directory VM
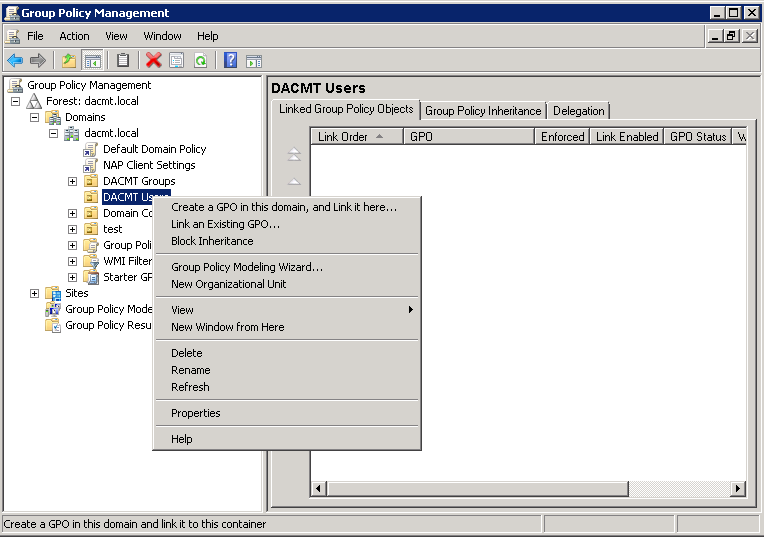
  • Open Group Policy Management
  • Right click on your chosen OU and select Create a GPO in this domain and link it here

bginfo12

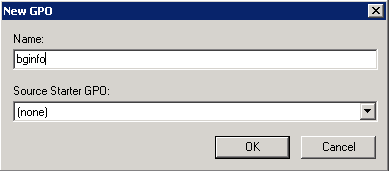
  • Type a name for your GPO

bginfo13

  • Now right click on the bginfo GPO and click edit
  • Go to User Configuration > Policies > Windows Settings > Scripts (Logon/Logoff)

bginfo14

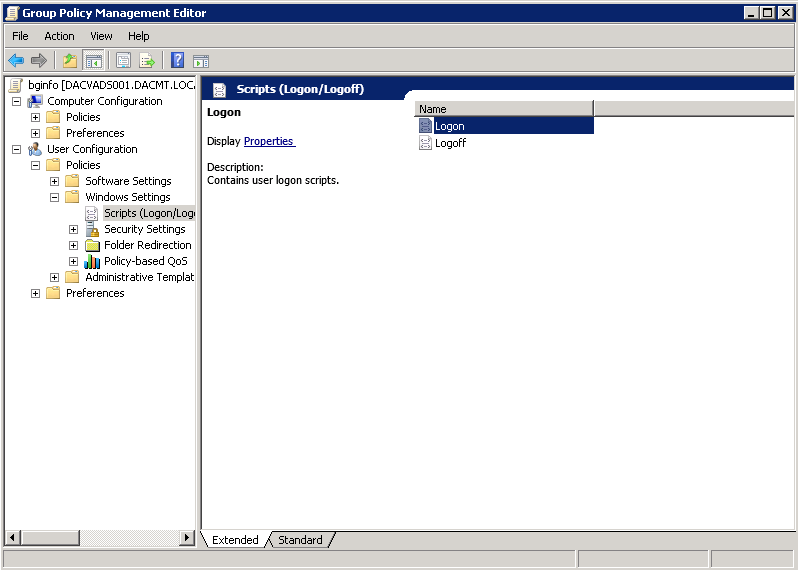
  • Double click on Logon
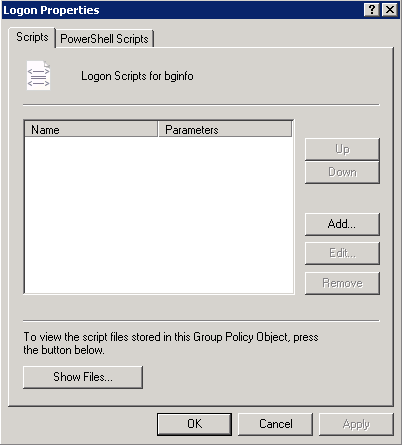
bginfo15

  • Click Add

bginfo20

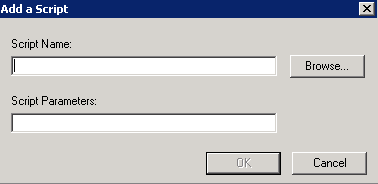
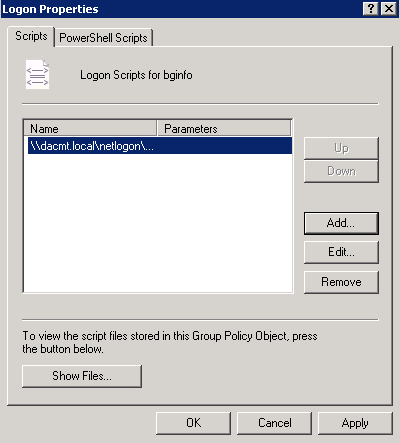
  • Browse and find your script

bginfo21

  • Click OK to get back to the scripts box and check everything looks OK

bginfo22

  • Go to Computer Configuration > Policies > Windows Settings > Scripts (Startup/Shutdown)
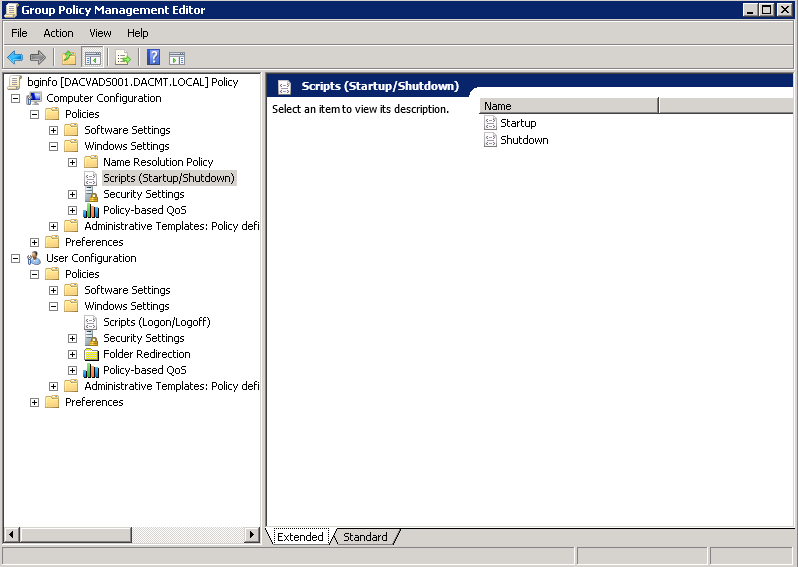
bginfo23

  • Click Startup

bginfo24

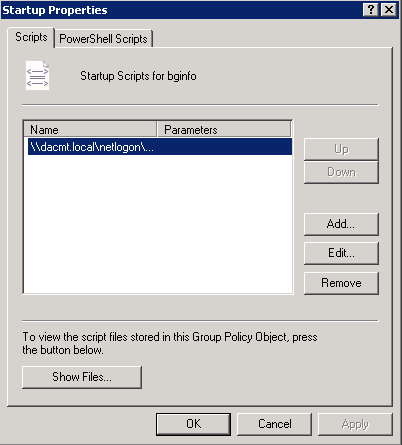
  • Click Add and navigate to \\dacmt.local\netlogon\bginfo\bginfo.cmd or bginfo.bat depending what you have set up
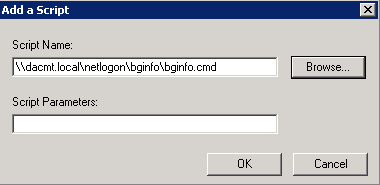
bginfo25

  • Click OK
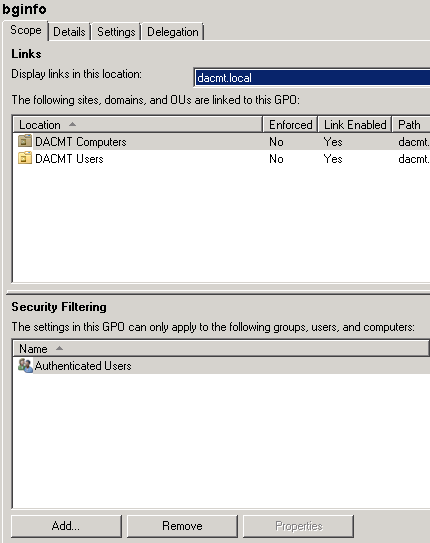
  • You may need to link this to the OU where your Computers are that you want applying. See screenprint below
  • You can also change the scope of the GPO to include the Users and Computers you want. See screenprint below

bginfo27

  • You may also want to adjust the following policy
  • Computer Configuration > Policies > Administrative Templates > System > Logon > Run these Programs at User Logon
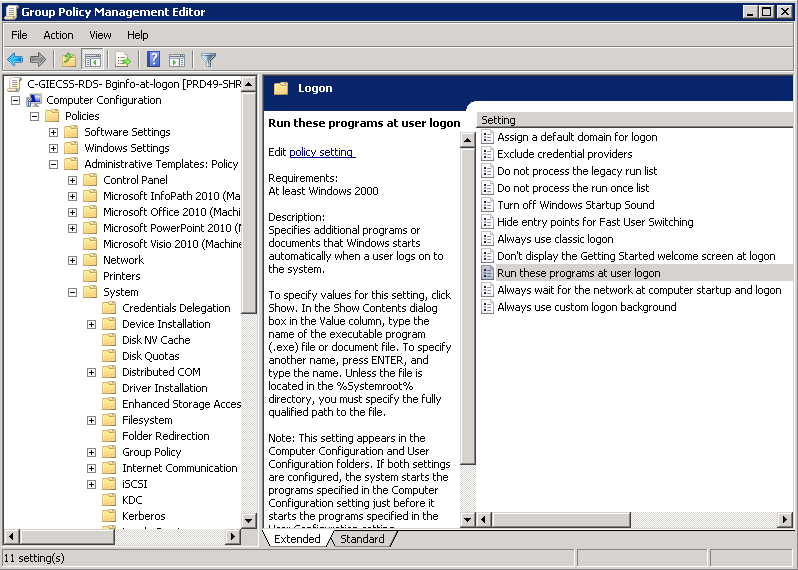
bginfo50

  • Click Enabled
  • Click Show
  • Type in \\dacmt.local\netlogon\bginfo\bginfo.cmd
  • And now when you log on to a VM/Computer in the scope of the GPO, you should see the following

bginfo30

Other GPOs to consider

  • Sometimes when you are using a network share for the path to your script, you may encounter an error as per below when the bginfo script runs

FileError

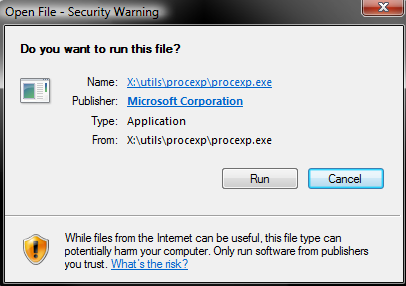
  • There are 3 Group Polices which may fix this
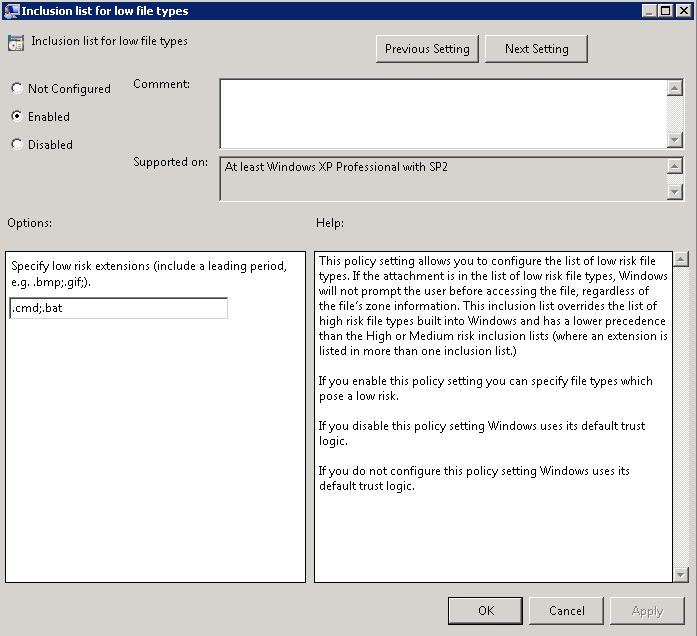
  • The first is User Configuration > Policies > Windows Components > Attachment Manager > Inclusion list for low file types. Set to enabled and add the extensions you trust… In this case .bat and .cmd

bginfogpo1

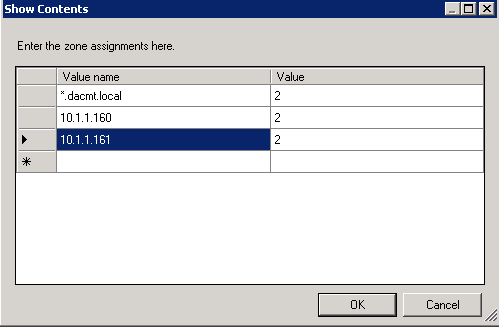
  • The second policy is Computer Configuration > Policies > Administrative Templates > Internet Explorer > Internet Control Panel > Security Page > Site to Zone assignment list
  • Select Enabled

bginfogpo2

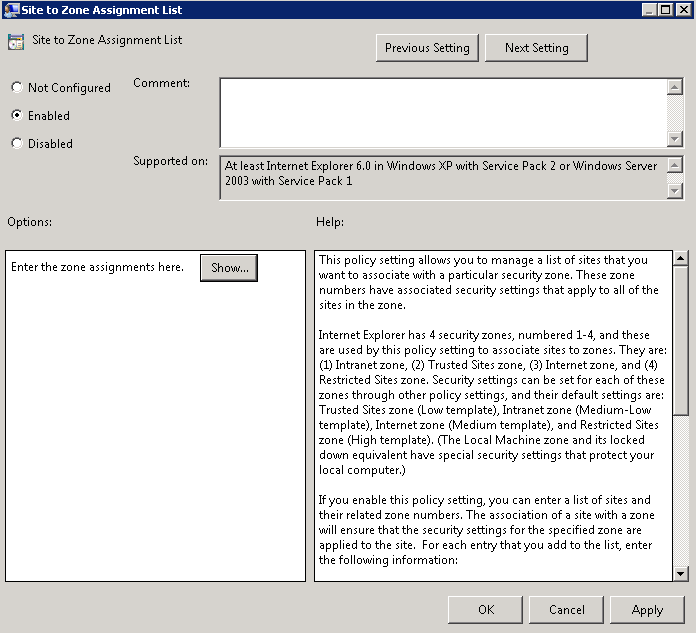
  • Then click Show. Note I have entered the domain name and the 2 servers which hold my bginfo script by IP Address

bginfogpo3

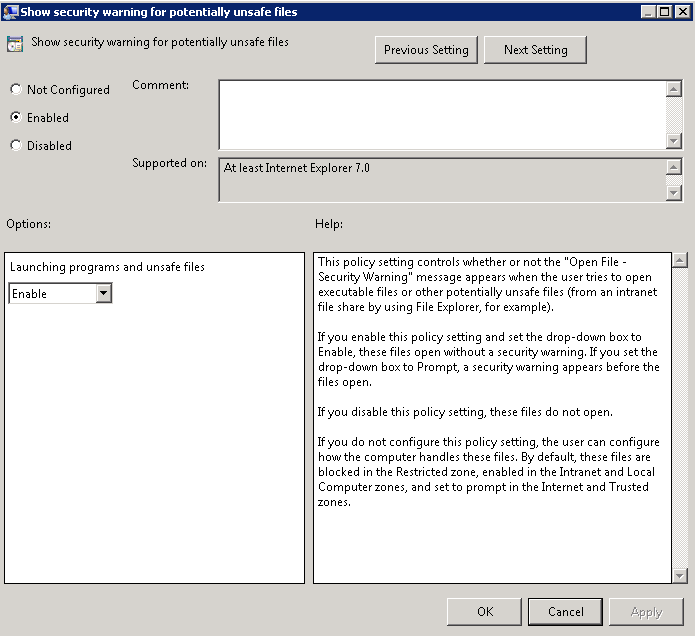
  • The 3rd Policy is Computer Configuration > Policies > Administrative Templates > Internet Explorer > Internet Control Panel > Security Page > Trusted Site Zone > Show security warning for potentially unsafe files
  • Select Enabled

bginfogpo4

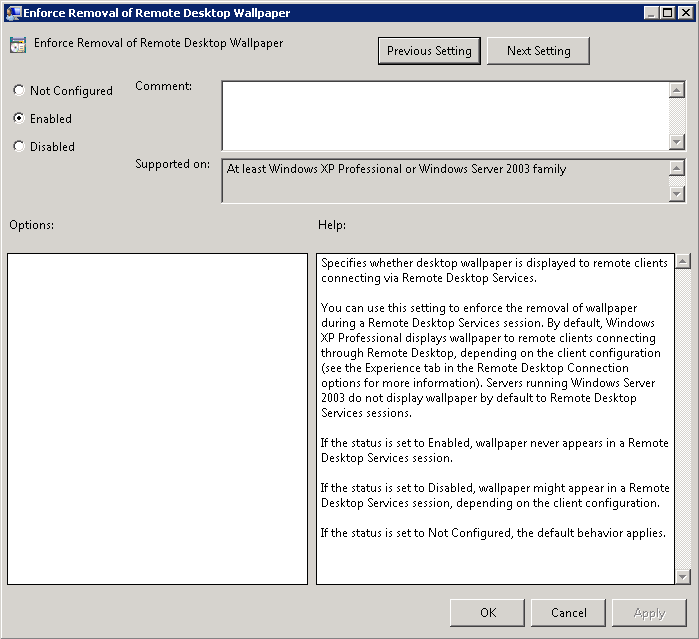
  • There is also a GPO setting unrelated to the 3 GPOs we have just covered called Computer Configuration > Policies > Administrative Templates > Windows Components > Remote Desktop Services > Remote Desktop Session Host > Remote Session Environment > Enforce removal of Remote Desktop Wallpaper > Enabled
  • Personally I don’t use this but it was mentioned somewhere else so may be relevant to someone!

bginfo28

Useful GPO Tutorial on Youtube

http://www.youtube.com/watch?v=Dq0jbRkvNDA

Keep Data in Sight

BGInfo’s customization and extensibility let you use it to display commonly accessed data on your own desktop or to perform thorough inventories of all the computers on your network. You can download the tool and get more information about its operation at

http://technet.microsoft.com/en-gb/sysinternals/bb897557.aspx

You can also do the following

http://www.redkitten.co.uk/windows-server/using-bginfo-on-windows-server-2008/

VMware VMDK Files

VMDK Files

These are the disk files that are created for each virtual hard drive in your VM. There are 3 different types of files that use the vmdk extension, they are:

  • *–flat.vmdk file – This is the actual raw disk file that is created for each virtual hard drive. Almost all of a .vmdk file’s content is the virtual machine’s data, with a small portion allotted to virtual machine overhead. This file will be roughly the same size as your virtual hard drive.
  • *.vmdk file – This isn’t the file containing the raw data anymore. Instead it is the disk descriptor file which describes the size and geometry of the virtual disk file. This file is in text format and contains the name of the –flat.vmdk file for which it is associated with and also the hard drive adapter type, drive sectors, heads and cylinders, etc. One of these files will exist for each virtual hard drive that is assigned to your virtual machine. You can tell which –flat.vmdk file it is associated with by opening the file and looking at the Extent Description field.
  • *–delta.vmdk file – This is the differential file created when you take a snapshot of a VM (also known as REDO log). When you snapshot a VM it stops writing to the base vmdk and starts writing changes to the snapshot delta file. The snapshot delta will initially be small and then start growing as changes are made to the base vmdk file, The delta file is a bitmap of the changes to the base vmdk thus is can never grow larger than the base vmdk. A delta file will be created for each snapshot that you create for a VM. These files are automatically deleted when the snapshot is deleted or reverted in snapshot manage

What is the difference between Program files (x86) and Program files folders on Windows Servers?

Program files (x86) provides you with the location for 32bit software, and the Program files folder is the one for your 64bit software. Because Windows Vista can run 32bit applications using the wow64 emulator, it is a good design decision to separate the location of programs with different architecture types.

If you are just simply installing programs, either from their media or from a download, then you don’t need to worry about which directory they will get installed to as this is taken care of for you.

Generally speaking, unless a program specifically mentions 64-bit then it will be installed in the (x86) folder. Note that some programs do not install in either folder; instead they create and use their own.

They’re kept separate so you can have both the 32bit and 64bit version of the same software installed at the same time. It’s also there for compatibility, as some 32bit programs depend on certain resources being in the “Common Files” folder that wouldn’t usually be available (or overwritten by a 64bit version) on a 64bit system.

Microsoft themselves uses it this way for some of their own applications. You have two copies of Windows Media Player, one 32bit (in Program Files (x86) and the other 64bit (in Program Files).

Key Windows Performance Counters, Info and Limits

Key Windows Performance Counters, Info and Limits

Counter

Description

What to watch for

Logical Disk\% Free Space Measures the percentage of free space of the selected Logical Disk If it is below 15% then you run the risk of running out of space to store critical O/S files
PhysicalDisk\Idle Time Measures the percentage of time the disk was idle during the sample interval If this value falls below 20% the disk system is said to be saturated and you should install a faster disk system
PhysicalDisk\Avg. Disk Sec/Read Measures the average time in seconds to read data from the disk If this value is larger than 25 milliseconds the disk system is experiencing latencyFor SQL and Exchange the threshold is lower – 10ms
PhysicalDisk\Avg. Disk Sec/Write Measures the average time in seconds to write data from the disk If this value is larger than 25 milliseconds the disk system is experiencing latencyFor SQL and Exchange the threshold is lower – 10ms
Physical Disk\Avg Queue Length How many I/O Operations are waiting for the Hard Drive to become available If the value of the counter is larger than twice the number of disk spindles in an array then the disk may be a bottleneck
Memory\Cache Bytes Indicates the amount of memory being used for the file system cache. There will be a bottleneck if the value is greater than 300MB
Processor\%Idle Time % Idle Time is the percentage of time the processor is idle during the sample interval Below 20% and you are running at CPU saturation if this prolonged
Processor\Interrupts/sec The numbers of interrupts the processor was asked to respond to. Interrupts are generated from hardware components like hard disk controller adapters and network interface cards. A sustained value over 1000 is usually an indication of a problem. Problems would include a poorly configured drivers, errors in drivers, excessive utilization of a device (like a NIC on an IIS server), or hardware failure
Processor\%Processor Time Measures  how much time the processor actually spends working on productive threads and how often it was busy servicing requests. It actually provides a measurement of how often the system is doing nothing subtracted from 100%. This is a simpler calculation for the processor to make. The processor can never be sitting idle waiting to the next task, unlike our cashier. The CPU must always have something to do. It’s like when you turn on the computer, the CPU is a piece of wire that electric current is always running through, thus it must always be doing something. NT give the CPU something to do when there is nothing else waiting in the queue. This is called the idle thread. The system can easily measure how often the idle thread is running as opposed to having to tally the run time of each of the other process threads. Then , the counter simply subtracts the percentage from 100%. This counter is a natural choice that will give use the amount of time that this particular process spends using the processor resource.
Memory\Page Faults/sec This counter gives a general idea of how many times information being requested is not where the application (and VMM) expects it to be. The information must either be retrieved from another location in memory or from the pagefile. While a sustained value may indicate trouble here, you should be more concerned with hard page faults that represent actual reads or writes to the disk. Remember that the disk access is much slower than RAM
Memory\%Committed Bytes in use This counter indicates the total amount of memory that has been committed for the exclusive use of any of the services or processes on Windows NT. Should this value approach the committed limit, you will be facing a memory shortage of unknown cause, but of certain severe consequence.
Memory\Available Bytes This counter indicates the amount of memory that is left after nonpaged pool allocations, paged pool allocations, process’ working sets, and the file system cache have all taken their piece.
System\System Calls/sec This counter is a measure of the number of calls made to the system components, Kernel mode services. This is a measure of how busy the system is taking care of applications and services—software stuff. When compared to the Interrupts/Sec it will give you an indication of whether processor issues are hardware or software related. See Processor : Interrupts/Sec for more information
System\Threads Threads is the number of threads in the computer at the time of data collection. This is an instantaneous count, not an average over the time interval.  A thread is the basic executable entity that can execute instructions in a processor. Monitor loosely
System\Processor Queue Length Gives an indication of how many threads are waiting for execution. If this counter is consistently higher than around 5 when processor utilization approaches 100%, then this is a good indication that there is more work (active threads) available (ready for execution) than the machine’s processors are able to handle. Note that this is not always a hard and fast indicator however, for some services like IIS 6 pool and manage their own worker threads, so on a busy web server for example you would want to look at other counters like ASP\Requests Queued or ASP.NET\Requests Queued as well. Furthermore, the larger the number of active services and applications running on your server, the busier the processor queue will normally be, so on a multi-role server running near 100% utilization content may only be a significant factor once System\Processor Queue Length exceeds something like 10 instead of 5 as mentioned previously.
Network Interface : Bytes Sent/sec This is how many bytes of data are sent to the NIC. This is a raw measure of throughput for the network interface. We are really measuring the information sent to the interface which is the lowest point we can measure. If you have multiple NIC, you will see multiple instances of this particular counter. Dependent on NIC Speed
Network Interface: Bytes Received/sec. This, of course, is how many bytes you get from the NIC. This is a measure of the inbound traffic In measuring the bytes, NT isn’t too particular at this level. So, no matter what the byte is, it is counted. This will include the framing bytes as opposed to just the data Dependent on NIC Speed


Storage/Datastore Reclamation in VMware

Sometimes, it is worth doing a storage reclamation exercise through all your VMware Datastores in order to remove old folder, files and to check that nothing miscellaneous is going on.

What can you find?

In vCenter > Datastores > Performance Tab, you can find the graph showing all the files it can detect with the selection “Other VM Files” OR “Other” which is what we’re interested in.

When we checked this out on the Host back-end logged in via Putty, we can see the below. The ./ files are not usual to find on LUNs/Datstores and indicate that there are SAN snapshots existing on here

/vmfs/volumes/4e0da454-902c23bf-cb36-e61f13f7c69b # ls -l

SERVER01
SERVER02
SERVER03

/vmfs/volumes/4e0da454-902c23bf-cb36-e61f13f7c69b # find . -exec ls -lh {} \; | grep flat

SERVER01-flat.vmdk
SERVER01_1-flat.vmdk
SERVER01_2-flat.vmdk
SERVER01_3-flat.vmdk

./SERVER01/SERVER01_3-flat.vmdk
./SERVER01/SERVER01_2-flat.vmdk
./SERVER01/SERVER01_1-flat.vmdk
./SERVER01/SERVER01-flat.vmdk

Conclusion

You will need to ask your Storage Admin to check out your LUNs and make sure that any old snapshots are either required or can be deleted.

It is worth keeping an eye on all of this as we found we had nearly 2TB of LUN Snapshots lurking around taking up valuable and expensive storage space.

Reliability Monitor in Windows 2008

Reliability Monitor is an advanced tool which measures hardware and software problems and changes to the computer. It provides a stability index which ranges from 1 (Least Stable) to 10 (Most Stable)

Accessing Reliability Monitor

You can access it 2 ways.Either by typing in perfmon/rel or following the steps below

  • Open Action Center
  • Click Maintenance
  • Then under Check for Solutions to Problem Reports, click View Reliability History

What can you do?

  • Click on any event on the graph to view details
  • Click Days or Weeks to view the stability index
  • Click items in the Action Pane to view more info about it
  • Click View All Problem Reports to view only the problems that have occurred on your computer

Gathering System Stability Data

The Reliability Monitor displays data gathered by the Reliability Analysis Component (RAC) This is implemented using RACAgent.exe which is scheduled to run once an hour. Reliability Monitor starts displaying a system stability index rating and specific event information 24 hours after system installation, and the RACAgent task runs by default after that O/S is installed. If it has been disabled, it must be manually enabled from the Task Scheduler snap-in for the MMC.

Enable RACAgent

To enable to RACAgent Task, you must use an account which is a member of the Local Administrators Group on the computer.

  • Click Start > Search > Type taskschd.msc
  • Expand Task Scheduler Library
  • Expand Microsoft
  • Expand Windows
  • Select RAC
  • Right click RAC and select View and Show Hidden Tasks
  • In the Results Pane, right click RACAgent and select Enable

Performance and Resource Monitoring in Windows Server 2008

What does Windows Reliability and Performance Monitor do?

Windows Reliability and Performance Monitor is a Microsoft Management Console (MMC) snap-in that combines the functionality of previous stand-alone tools including Performance Logs and Alerts, Server Performance Advisor, and System Monitor. It provides a graphical interface for customizing performance data collection and Event Trace Sessions.

It also includes Reliability Monitor, an MMC snap-in that tracks changes to the system and compares them to changes in system stability, providing a graphical view of their relationship

What new functionality does this feature provide?

Features of Windows Reliability and Performance Monitor new to Windows Server 2008 include the following.

Data Collector Sets

An important new feature in Windows Reliability and Performance Monitor is the Data Collector Set, which groups data collectors into reusable elements for use with different performance monitoring scenarios. Once a group of data collectors are stored as a Data Collector Set, operations such as scheduling can be applied to the entire set through a single property change.

Windows Reliability and Performance Monitor also includes default Data Collector Set templates to help system administrators begin collecting performance data specific to a Server Role or monitoring scenario immediately.

Wizards and templates for creating logs

Adding counters to log files and scheduling their start, stop, and duration can now be performed through a Wizard interface. In addition, saving this configuration as a template allows system administrators to collect the same log on subsequent computers without repeating the data collector selection and scheduling processes. Performance Logs and Alerts features have been incorporated into the Windows Reliability and Performance Monitor for use with any Data Collector Set.

Resource View

The home page of Windows Reliability and Performance Monitor is the new Resource View screen, which provides a real-time graphical overview of CPU, disk, network, and memory usage. By expanding each of these monitored elements, system administrators can identify which processes are using which resources. In previous versions of Windows, this real-time process-specific data was only available in limited form in Task Manager.

Reliability Monitor

Reliability Monitor calculates a System Stability Index that reflects whether unexpected problems reduced the reliability of the system. A graph of the Stability Index over time quickly identifies dates when problems began to occur. The accompanying System Stability Report provides details to help troubleshoot the root cause of reduced reliability. By viewing changes to the system (installation or removal of applications, updates to the operating system, or addition or modification of drivers) side by side with failures (application failures, operating system crashes, or hardware failures), a strategy for addressing the issues can be developed quickly.

Unified property configuration for all data collection, including scheduling

Whether creating a Data Collector Set for one time use or to log activity on an ongoing basis, the interface for creation, scheduling, and modification is the same. If a Data Collector Set proves to be useful for future performance monitoring, it does not need to be re-created. It can be reconfigured or copied as a template.

User-friendly diagnosis reports

Users of Server Performance Advisor in Windows Server 2003 can now find the same kinds of diagnosis reports in Windows Reliability and Performance Monitor in Windows Server 2008. Report generation time is improved and reports can be created from data collected by using any Data Collector Set. This allows system administrators to repeat reports and assess how changes have affected performance or the report’s recommendations.

Accessing Performance Monitor

Membership in the local Performance Log Users group, or equivalent, is the minimum required to complete this procedure.

To start Performance Monitor

  • Click Start, click in the Start Search box, type perfmon, and press ENTER.
  • In the navigation tree, expand Monitoring Tools, and then click Performance Monitor.

You can also use Performance Monitor to view real-time performance data on a remote computer.

Membership in the target computer’s Performance Log Users group, or equivalent, is the minimum required to complete this procedure

To view performance counters from a remote computer, the Performance Logs and Alerts firewall exception must be enabled on the remote computer. In addition, members of the Performance Log Users group must also be members of the Event Log Readers group on the remote computer

Creating Data Collection Sets

A Data Collector Set is the building block of performance monitoring and reporting in Windows Performance Monitor. It organizes multiple data collection points into a single component that can be used to review or log performance. A Data Collector Set can be created and then recorded individually, grouped with other Data Collector Set and incorporated into logs, viewed in Performance Monitor, configured to generate alerts when thresholds are reached, or used by other non-Microsoft applications. It can be associated with rules of scheduling for data collection at specific times. Windows Management Interface (WMI) tasks can be configured to run upon the completion of Data Collector Set collection.

Data Collector Sets can contain the following types of data collectors:

  • Performance counters
  • Event trace data
  • System configuration information (registry key values)

Real Time Example

  • Start Performance Monitor
  • Right-click anywhere in the Performance Monitor display pane, point to New, and click Data Collector Set. The Create New Data Collector Set Wizard starts. The Data Collector Set created will contain all of the data collectors selected in the current Performance Monitor view.

  • Type in a name for your Data Collection Set and Choose from Template

  • Choose a Template (System Performance for this example)

  • Choose where the Data is going to be saved

  • Choose who to run this as. If you have permissions then this can be left as default. Choose to open the properties for this job

  • The General Tab

  • Click Directory

  • Click Security

  • Click Schedule

  • Stop Condition

  • Click Task

Reports

When this job has finished, Performance Monitor will reconcile a report to show the full history of this job.

Analysing the Results

Data Analysis
A tool that Microsoft support relies on to analyze Performance Monitor logs is the Performance Analysis of Logs (PAL) Tool. Clint Huffman, a Microsoft senior premier field engineer, wrote the 6,000-line VBScript tool, which is free and open source. PAL lets administrators easily analyze Performance Monitor logs without requiring them to be experts in performance counters or Windows architecture.

PAL contains a wizard-based UI that asks specific information about the system, which PAL passes as arguments to the VBScript program. PAL picks up where other log analyzers leave off, such as taking into account whether the system is 64-bit or 32-bit, whether the /3GB switch is used, and how much physical memory is installed—all variables that affect system performance. PAL uses these variables along with known thresholds, which were determined by engineers with years of experience, to determine the analysis that’s displayed. PAL provides a chronological order of alerts, so that you can correlate your system’s performance to any problems that you noticed at specific times.

Counters and Limits

http://technet.microsoft.com/en-us/library/cc768048.aspx

Planning a Terminal Services Deployment

The first step in planning a deployment is understanding how the following Terminal Sever components fit together

  • Terminal Server

The server itself is at the core component of a Terminal Services deployment. This is the server that the clients connect to so they can access their applications

  • Terminal Server Farm

A Terminal Server farm is a collection of Terminal Servers used to provide high availability and load balancing to clients on an organisational network. Client connections to Terminal Server Farms are mediated by Terminal Services Session Directory Servers. Terminal Server farms are more likely to be deployed at large sites than small ones

  • License Servers

License servers provide Terminal Server Client Access Licenses (TS CALS) to Terminal Servers on the network. Unless a license server is deployed, clients are only able to connect to Terminal Services for a limited time only.

  • Terminal Services Gateway Servers (TS Gateway)

These servers provide access to Terminal Servers to clients on untrusted networks. In Enterprise networks, you can use a TS Gateway server as a bridge between the standard internal network and a Terminal Server farm on a network protected by server isolation policies

Terminal Server Licensing

All clients that connect to a Terminal Server require a TS CAL. This license is not included with the O/S a client uses or a standard server license.

TS CALs are managed by a Terminal Server Licensing server

  • What is the scope of the licensing server. Will it service clients in the domain or workgroup or manage the licenses for all clients in the forest
  • How will the license server be activated with Microsoft. Automatic, Web Browser or Telephone
  • How many license servers do you need for your organisation?
  • What type of licenses will be deployed

Terminal Server Session Broker

The Terminal Server Session Broker service simplifies the process of adding more capacity to an existing Terminal Services Deployment. It enables Load Balancing of terminal services in a group and ensures the reconnection of clients to existing sessions in that group. In Terminal Server Session Broker, a group of Terminal Servers is called a Farm.

The Terminal Server Session Broker is a database which keeps track of TS sessions. TS can work with DNS Round Robin or with NLB. When configured with NLB, the Terminal Server Session Broker Service monitors all servers in the group and allocates clients to to the servers which have the most amount of free resource.

When used with DNS Round Robin, clients are still distributed, the main benefit being is that Terminal Server Session Broker remembers where a client is connected. TS Load Balancing is restricted to Windows 2008 Terminal Servers only

Clients must support RDP 5.2 or later

Each Terminal Server must have the same application configuration

The following diagram provides a more detailed representation of the traffic flow. In the diagrammed scenario, all terminal servers in the farm have host resource records in DNS that map to the terminal server farm name (“Farm1”). Therefore, any terminal server in the farm can act as a redirector and process the initial connection requests

http://technet.microsoft.com/en-us/library/cc772418(v=ws.10).aspx

Terminal Server Gateway Server

Plan the deployment of Terminal Server Gateway Servers when you need to enable RDP over HTTPS connections to RDP Servers located on Protected internal networks to clients on the internet or untrusted networks. TS Gateway servers are not limited to screened subnets between internal networks and the internet but can also be deployed to enable access to servers that are the subject of IPsec isolation policies

Network Connectivity Status Indicator and Resulting Internet Communication in Windows 7 and Windows Server 2008 R2

NCIS

Windows® 7 and Windows Server® 2008 R2 include a feature called Network Connectivity Status Indicator (NCSI), which is part of a broader feature called Network Awareness. Network Awareness collects network connectivity information and makes it available through an application programming interface (API) to services and applications on a computer running Windows 7 or Windows Server 2008 R2. With this information, services and applications can filter networks (based on attributes and signatures) and choose the networks that are best suited to their tasks. Network Awareness notifies services and applications about changes in the network environment, thus enabling applications to dynamically update network connections.

Network Awareness collects network connectivity information such as the Domain Name System (DNS) suffix of the computer and the forest name and gateway address of networks that the computer connects to. When called on by Network Awareness, NCSI can add information about the following capabilities for a given network:

  • Connectivity to an intranet
  • Connectivity to the Internet (possibly including the ability to send a DNS query and obtain the correct resolution of a DNS name)

What you will see

A yellow warning triangle in the System Tray looking like

and

What does Windows check, and in what order, before it announces that there are connectivity problems and displays the yellow triangle formed icon down at the task bar

Windows checks a Microsoft site for connectivity, using the Network Connectivity Status Indicator site.

  • NCSI sends a DNS lookup request for dns.msftncsi.com. This DNS address should resolve to 131.107.255.255. If the address does not match, then it is assumed that the internet connection is not functioning correctly.

The exact sequence of when which test is run is not documented; however, a little bit of digging around with a packet sniffing tool like Wireshark reveals some info.

It appears that on any connection, the first thing NCSI does is requests the text file (step 1 above). NCSI expects a 200 OK response header with the proper text returned. If the response is never received, or if there is a redirect, then a DNS request for dns.msftncsi.com is made. If DNS resolves properly but the page is inaccessible, then it is assumed that there is a working internet connection, but an in-browser authentication page is blocking access to the file. This results in the pop-up balloon above. If DNS resolution fails or returns the wrong address, then it is assumed that the internet connection is completely unsuccessful, and the “no internet access” error is shown.

The order of events appears to be slightly different depending on whether the wireless network is saved, has been connected to before even if it is not in the saved connections list, and possibly depending on the encryption type. The DNS and HTTP requests and responses showing up in Wireshark were not always consistent, even connecting to the same network, so it’s not entirely clear what causes different methods of detection under different scenario

Resolving this issue

  • http://technet.microsoft.com/en-us/library/ee126135%28v=ws.10%29.aspx
  • Check you can ping your DNS Servers
  • Check you can ping your Gateway
  • Check your server is listed correctly in DNS
  • Check DNS suffixes
  • Check proxy servers if you have any
  • Check your router
  • Check other servers have connection
  • Turn off the Indicator in Group Policy.
  • If everything checks out ok, Go into GPMC and Expand Computer Configuration, expand Administrative Templates, expand System, expand Internet Communication Management, and then click Internet Communication settings. In the details pane, double-click Turn off Windows Network Connectivity Status Indicator active tests, and then click Enabled
  • Change the Registry key to not query the server:  HKLM/system/currentcontrol
    set/services/nlasvc/parameters/internet – set enable activeprobing to 0

Remote Desktop Login always creates a temporary profile

Just a quick fix for this as this happened to me today and is a fairly annoying problem

Resolution

  • Log into server as an Administrative User
  • Start > Run regedit
  • [HKEY_LOCAL_MACHINE]\SOFTWARE\Microsoft\Windows NT\CurrentVersion\ProfileList
  • Delete the profile which is failing usually has a .bak extension
  • Try logging in again
  • Success