Tag Archive for Performance

Modifying a .ova file due to import issues.

What is a .ova file?

An OVA file is a virtual appliance used by virtualization applications such as VMware Workstation and Oracle VM Virtualbox. It is a package that contains files used to describe a virtual machine, which includes an . OVF descriptor file, optional manifest (. MF) and certificate files, and other related files.

The problem

I want to do some performance testing with VMmark – https://www.vmware.com/uk/products/vmmark.html . To do this I need to import/deploy the VMmark .ova file- vmmark3.1-template-020419.ova into my 6.7U3 vCenter, however when I try this a message appears which says it cannot import the .nvram file which is part of this .ova 🙁

So what do we do?!

First of all I need a .ovf / .ova editor because I am going to need to edit this .ova. I decided to choose VMware Open Virtualization Format Tool. 4.3.0

https://my.vmware.com/de/web/vmware/details?downloadGroup=OVFTOOL430&productId=742

I downloaded and installed it on my laptop (Windows 10) in C:\Program Files\VMware\VMware OVF Tool and you will see the below files

Next, I will find my downloaded VMmark file – vmmark3.1-template-020419.ova and unzip it into a folder. I can now see I have 4 files – A .mf file, a .ovf file, a .vmdk file and a .nvram file

The first thing I am going to do is delete the .nvram file from this folder.

Next, I am going to edit the vmmark3.1-template-020419.mf which I opened in Wordpad. I removed the section highlighted in yellow relating to nvram.

Next, I opened the vmmark3.1-template-020419.ovf file and removed the following sections highlighted in blue below relating to nvram and saved the file. This link was useful to me at this point – https://kb.vmware.com/s/article/67724

and

Now, that we have adjusted the .ovf file and the manifest file, we need to do another step before we are able to repackage the .ova again. As we edited the .OVF file and deleted content from it, the SHA1 checksum has changed. We need to recalculate the SHA1 checksum of the .ovf file to update it in the manifest file. Otherwise we will encounter issues while repackaging the .OVA file. Powershell can be used for this with the command below.

Get-FileHash C:\Users\rhian\Downloads\vmmark3.1-template-020419\vmmark3.1-template-020419.ovf -Algorithm SHA1

Copy the new hash and you will need to copy this into the vmmark3.1-template-020419.mf file for the .ovf line. Save the file. You do not have to run this for the .vmdk file as this has not changed.

I then copied all 3 unzipped files in my folder (vmmark3.1-template-020419.mf, vmmark3.1-template-020419.ovf and vmmark3.1-template-020419_disk0.vmdk) to the C:\Program Files\VMware\VMware OVF Tool folder

Now I can run a command in cmd.exe to repackage my files into a .ova file

ovftool.exe –allowExtraConfig vmmark3.1-template-020419.ovf new-vmmark3.1-template-020419.ova. Hopefully it completes successfully

Now you can try deploying the new-vmark3.1-templates-020419.ova into vCenter. Thankfully it worked great 🙂

Using HCIBench v1.6.3 to performance test vSAN 6.6

vSAN Load Testing Tool: HCIBench

*Note* HCIBench is now on v1.6.6 – Use this version.

VMware has a vSAN Stress and Load testing tool called HCIBench, which is provided via VMware’s fling capability. HCIbench can be run in versions 5.5 and upwards today as a replacement for the vSAN Proactive tests which are inbuilt into vSAN currently. I am running this against vSphere 6.5/vSAN 6.6 today. HCIBench provides more flexibility in defining a target performance profile as input and test results from HCIBench can be viewed in a web browser and saved to disk.

HCIBench will help simplify the stress testing task, as HCIBench asks you to specify your desired testing parameters (size of working set, IO profile, number of VMs and VMDKs, etc.) and then spawns multiple instances of Vdbench on multiple servers. If you don’t want to configure anything manually there is a button called Easyrun which will set everything for you. After the test run is done, it conveniently gathers all the results in one place for easy review and resets itself for the next test run.

HCIBench is not only a benchmark tool designed for vSAN, but also could be used to evaluate the performance of all kinds of Hyper-Converged Infrastructure Storage in vSphere environment.

Where can I can find HCI Bench?

There is a dedicated fling page which will provide access to HCIBench and its associated documentation. A zip file containing the Vdbench binaries from Oracle will also be required to be downloaded which can be done through the configuration page after the appliance is installed. You will need to register an account with Oracle to download this file but this doesn’t take long.

HCIBench Download: labs.vmware.com/flings/hcibench

HCIBench User Guidehttps://download3.vmware.com/software/vmw-tools/hcibench/HCIBench_User_Guide.pdf

Requirements

  • Web Browser: IE8+, Firefox or Chrome
  • vSphere 5.5 and later environments for both HCIBench and its client VMs deployment

HCIBench Tool Architecture

The tool is specifically designed for running performance tests using Vdbench against a vSAN datastore.
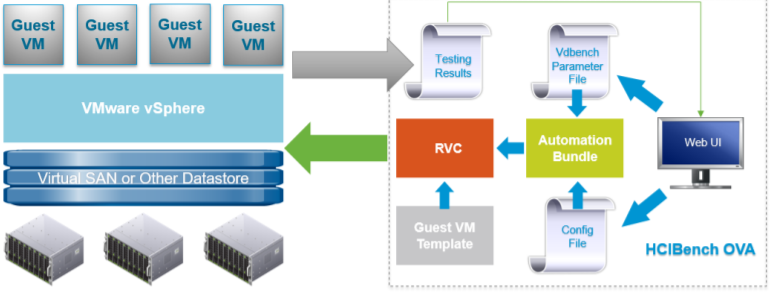
It is delivered in the form of Open Virtualization Appliance (OVA) that includes the following components:

The test Controller VM is installed with:

  • Ruby vSphere Console (RVC)
  • vSAN Observer
  • Automation bundle
  • Configuration files
  • Linux test VM template

The Controller VM has all the needed components installed. The core component is RVC (https://github.com/vmware/rvc) with some extended features enabled. RVC is the engine of this performance test tool, responsible for deploying Vdbench Guest VMs, conducting Vdbench runs, collecting results, and monitoring vSAN by using vSAN Observer.

VM Specification Controller VM

  • CPU: 8 vCPU
  • RAM: 4GB
  • OS VMDK: 16GB
  • Operating system: Photon OS 1.0
  • OS Credential: user is responsible for creating the root password when deploying the VM.
  • Software installed: Ruby 2.3.0, Rubygem 2.5.1, Rbvmomi 1.8.2, RVC 1.8.0, sshpass 1.05, Apache 2.4.18, Tomcat 8.54, JDK 1.8u102

Vdbench Guest VM

  • CPU: 4 vCPU
  • RAM: 4GB
  • OS VMDK: 16GB
  • OS: Photon OS 1.0
  • OS Credential: root/vdbench
  • Software installed: JDK 1.8u102, fio 2.13  SCSI Controller Type: VMware Paravirtual
  • Data VMDK: number and size to be defined by user

Pre-requisites

Before deploying this performance test tool packaged as OVA, make sure the environment meets the following requirements:

The vSAN Cluster is created and configured properly

  • The network for Vdbench Guest VMs is ready, and needs to have DHCP service enabled; if the network doesn’t have DHCP service, “Private Network” must be mapped to the same network when HCIBench being deployed.
  • The vSphere environment where the tool is deployed can access the vSAN Cluster environment to be tested
  • The tool can be deployed into any vSphere environment. However, we do not recommend deploying it into the vSAN Cluster that is tested to avoid unnecessary resource consumption by the tool.

What am I benchmarking?

This is my home lab which runs vSAN 6.6 on 3 x Dell Poweredge T710 servers each with

  • 2 x 6 core X5650 2.66Ghz processors
  • 128GB RAM
  • 6 x Dell Enterprise 2TB SATA 7.2k hot plug drives
  • 1 x Samsung 256GB SSD Enterprise 6.0Gbps
  • Perc 6i RAID BBWC battery-backed cache
  • iDRAC 6 Enterprise Remote Card
  • NetXtreme II 5709c Gigabit Ethernet NIC

Installation Instructions

  • Download the HCIBench OVA from https://labs.vmware.com/flings/hcibench and deploy it to your vSphere 5.5 or later environment.
  • Because the vApp option is used for deployment, HCIBench doesn’t support deployment on a standalone ESXi host, the ESXi host needs to be managed by a vCenter server.
  • When configuring the network, if you don’t have DHCP service on the VLAN that the VDBench client VMs will be deployed on, the “Private Network” needs to be mapped to the same VLAN because HCIBench will be able to provide the DHCP service.
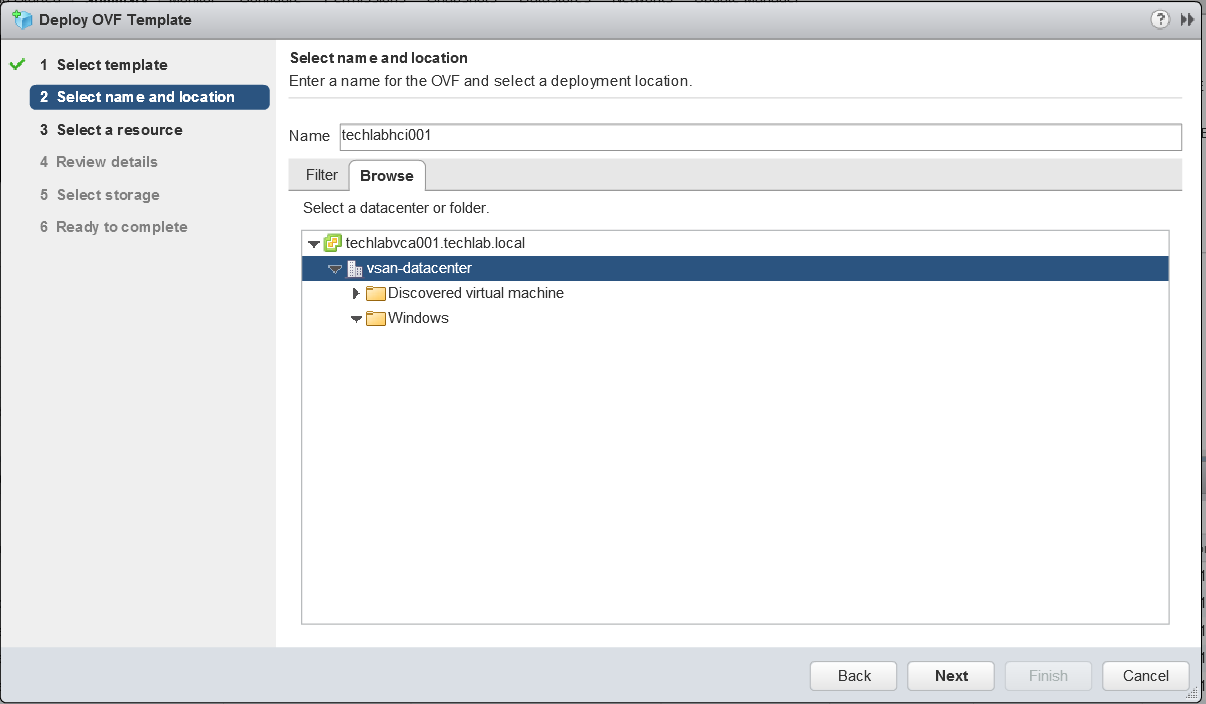
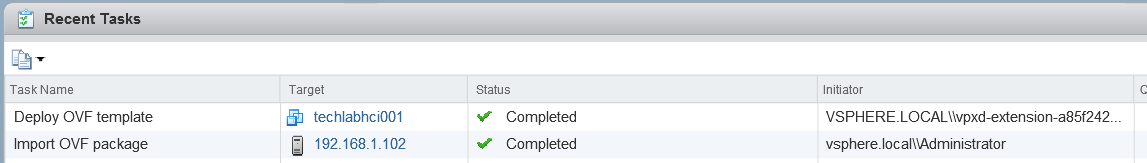
  • Log into vCenter and go to File > Deploy OVF File

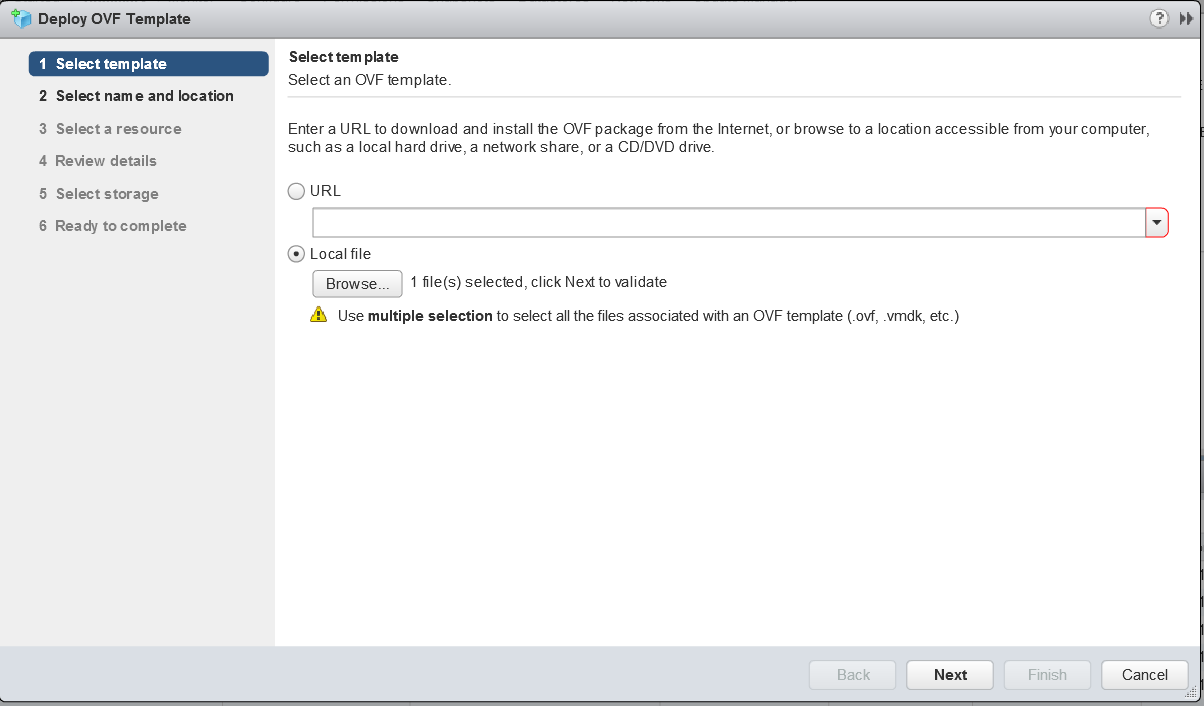
  • Name the machine and select a deployment location

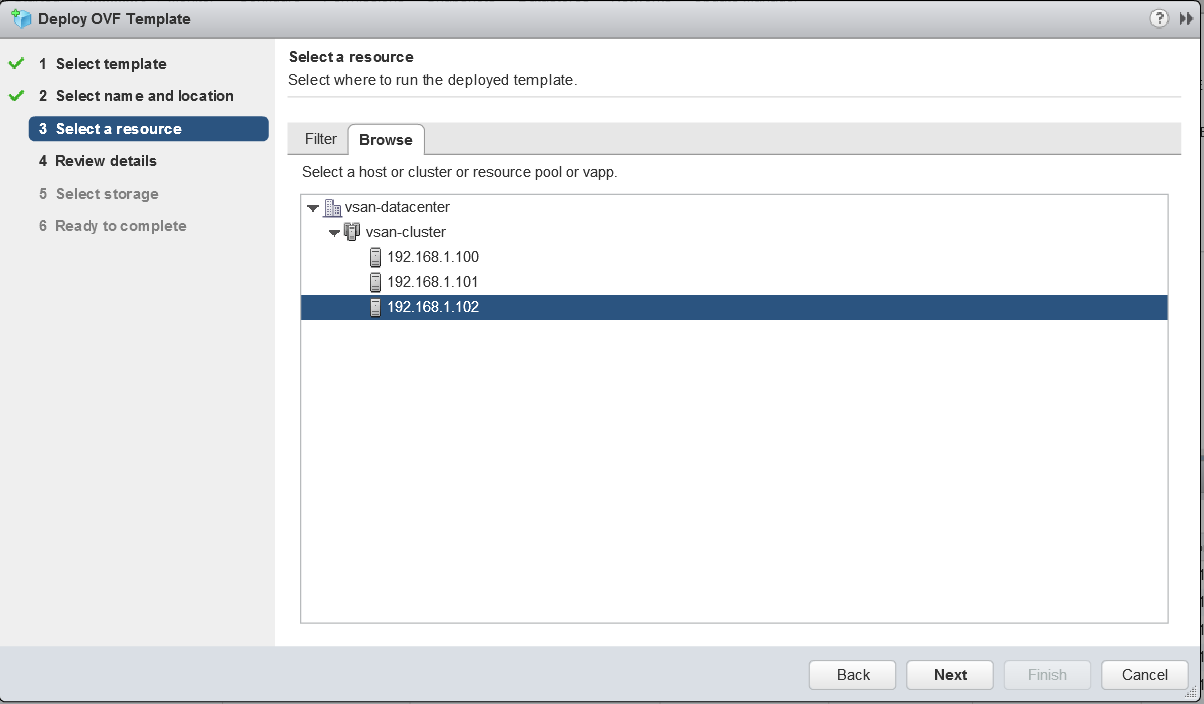
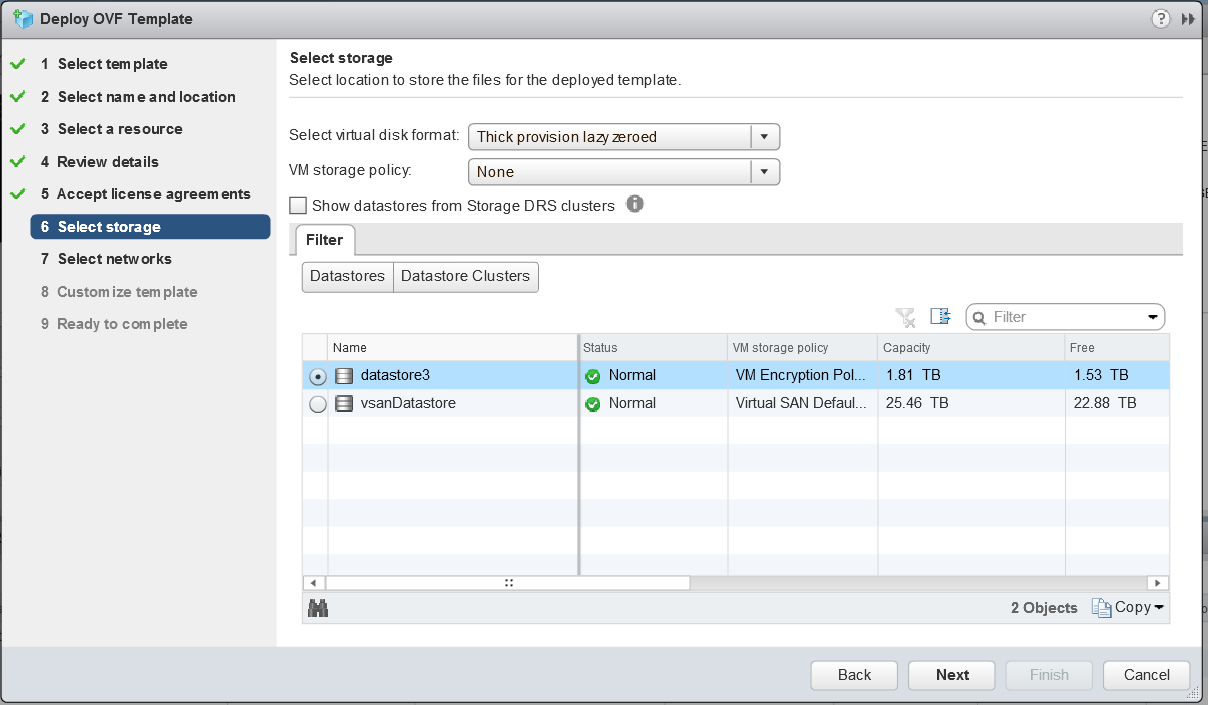
  • Select where to run the deployed template. I’m going to run it on one of my host local datastores as it is recommended to run it in a location other than the vSAN.

  • Review the details

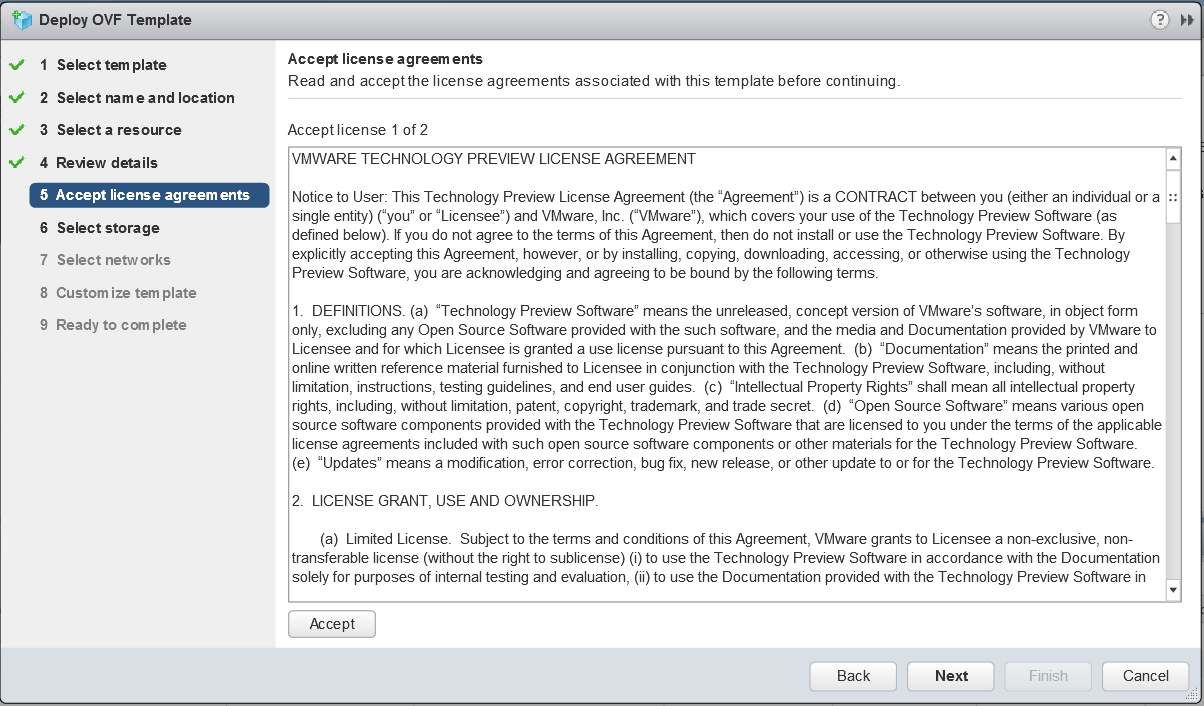
  • Accept the License Agreement

  • Select a storage location to store the files for the deployed template

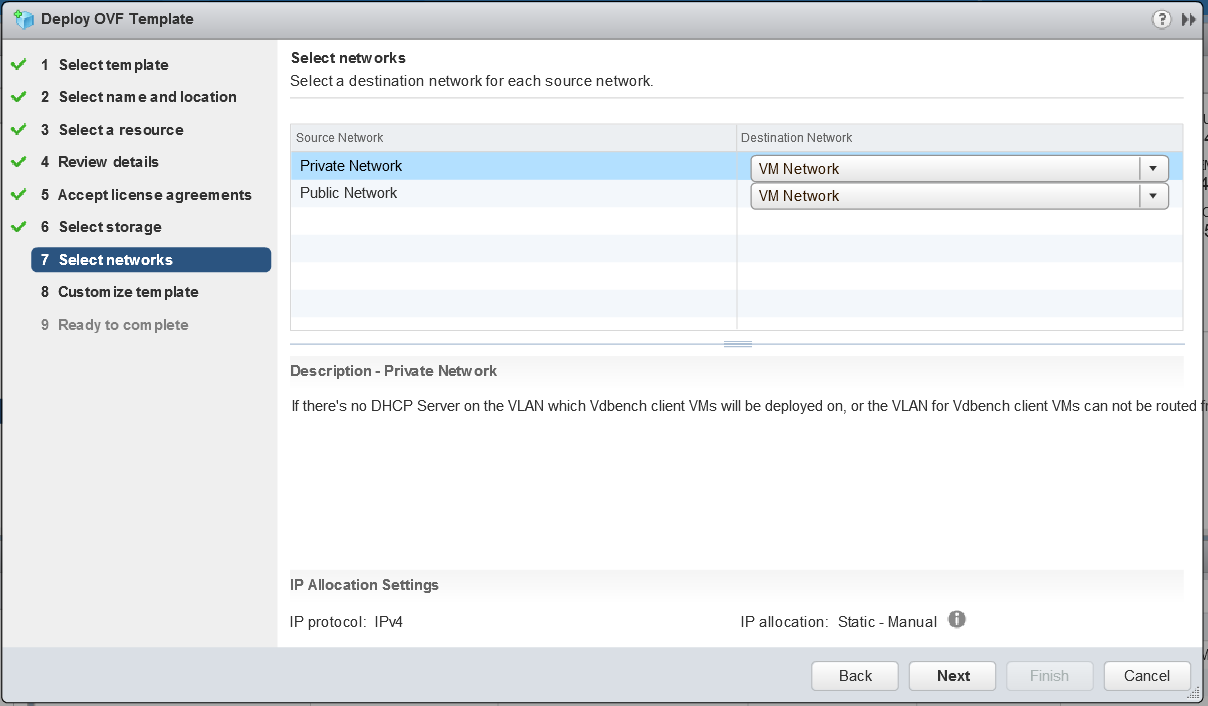
  • Select a destination network for each source network
  • Map the “Public Network” to the network which the HCIBench will be
    accessed through; if the network prepared for Vdbench Guest VM doesn’t have DHCP service, map the “Private Network” to the same network, otherwise just ignore the “Private Network”.

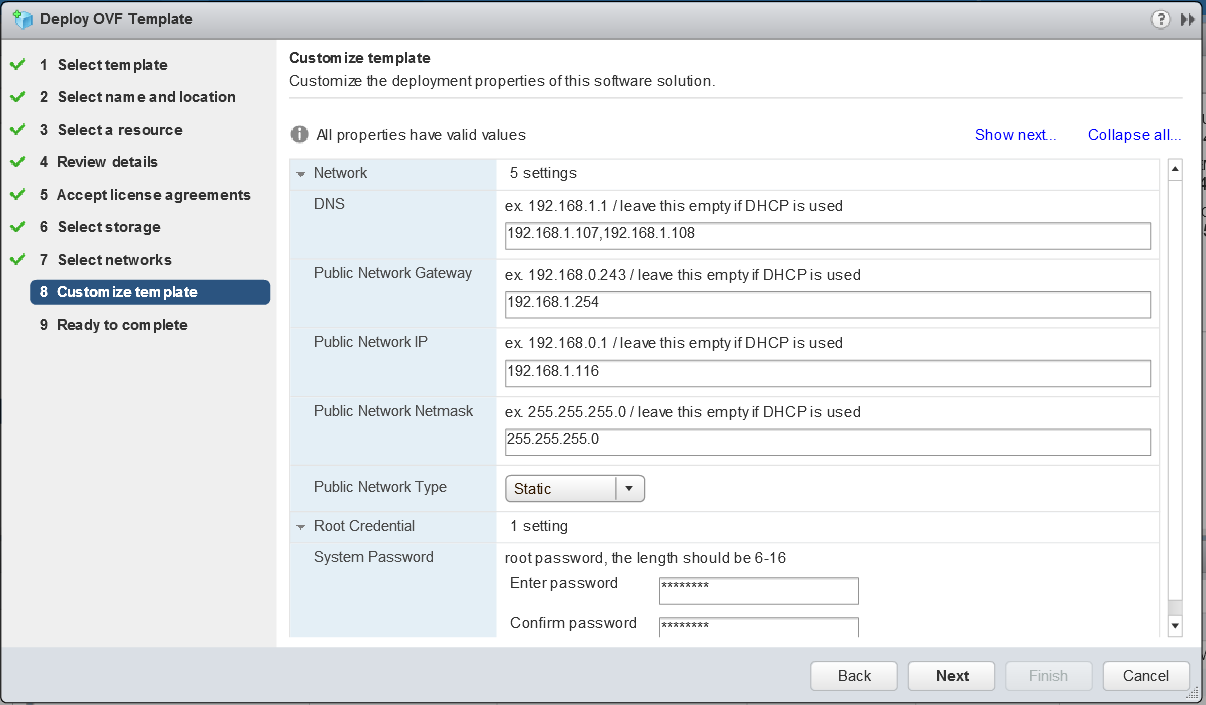
  • Enter the network details. I have chosen static and filled in the detail as per below. I have a Windows DHCP Server on my network which will issue IP Addresses to the worker VMs.
  • Note: I added the IP Address of the HCIBench appliance into my DNS Server

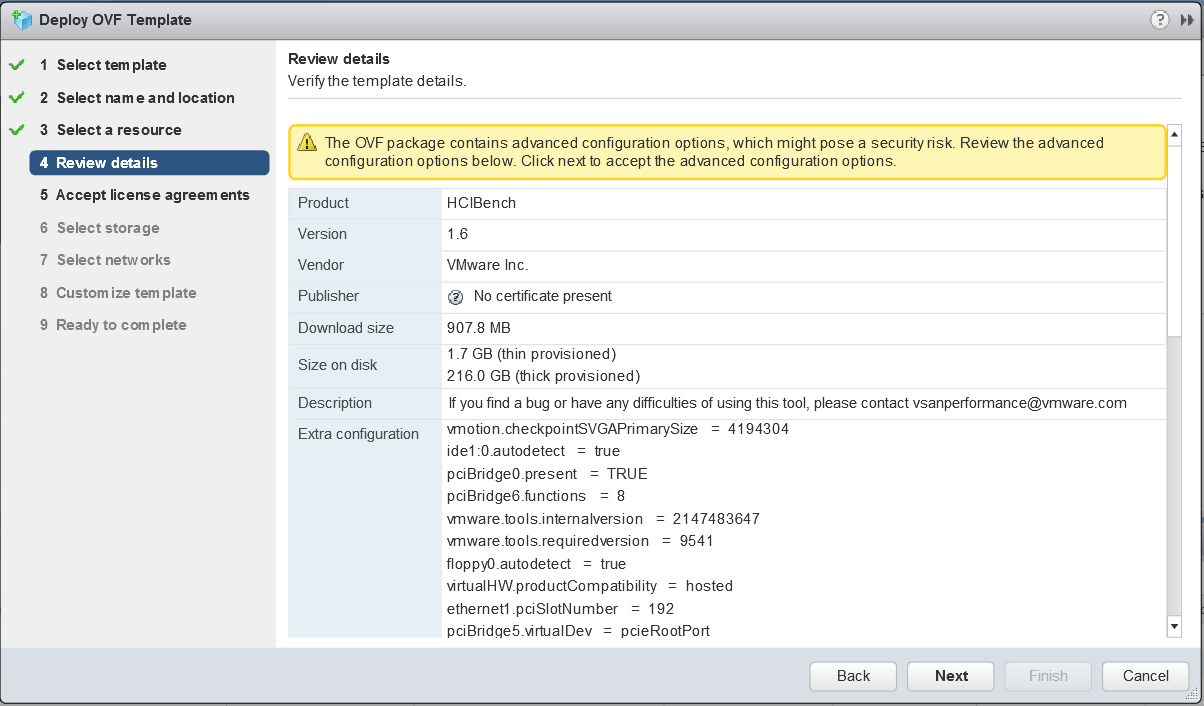
  • Click Next and check all the details

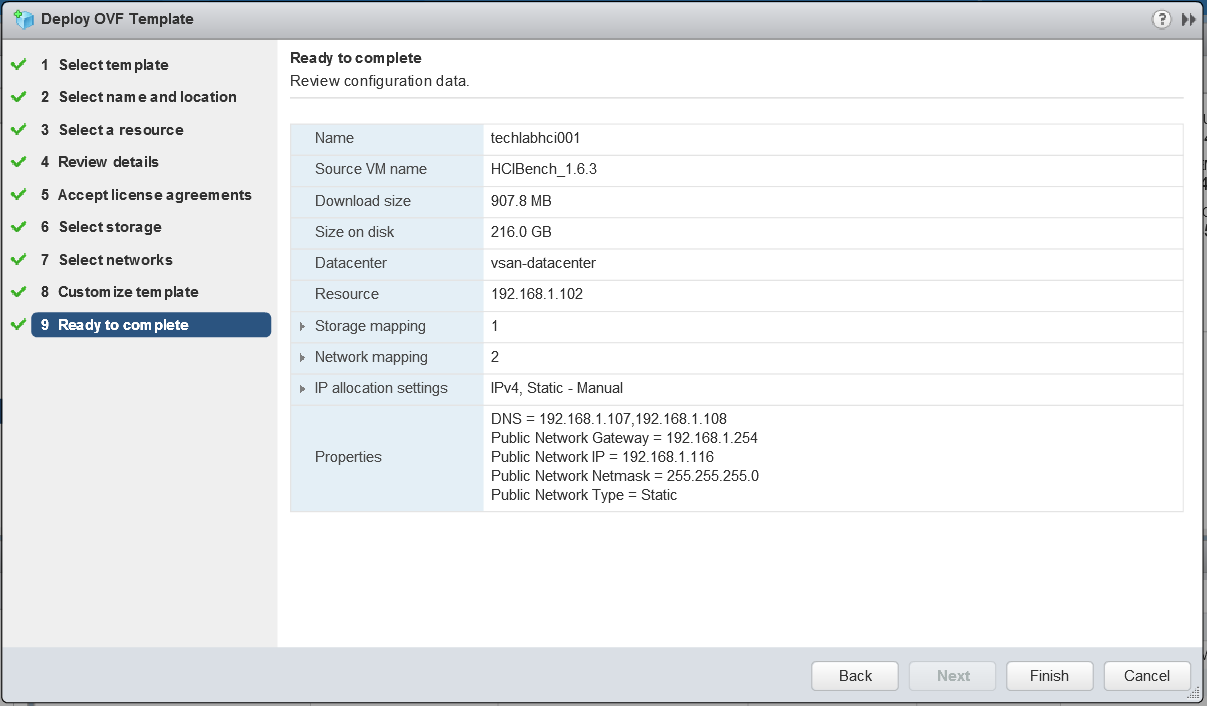
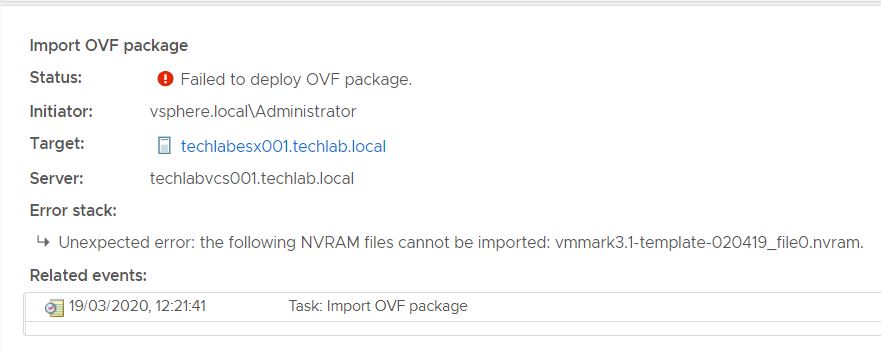
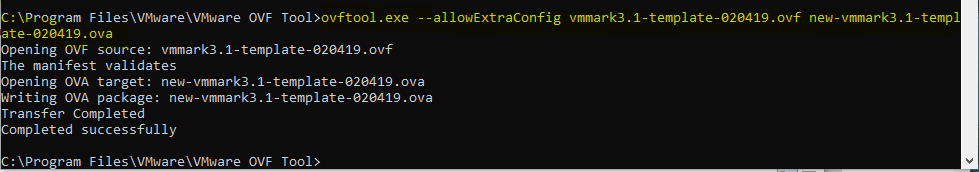
  • The OVF should deploy. If you get a failure with the message. “The OVF failed to deploy. The ovf descriptor is not available” then redownload the OVA and try again and it should work.

  • Next power on the Controller VM and go to your web browser and navigate to your VM using http://<Your_HCIBench_IP>:8080. In my case http://192.168.1.116:8080. Your IP is the IP address you gave it during the OVF deployment or the DHCP address it picked up if you chose this option. If it asks you for a root password, it is normally what you set in the Deploy OVF wizard.
  • Log in with the root account details you set and you’ll get the Configuration UI

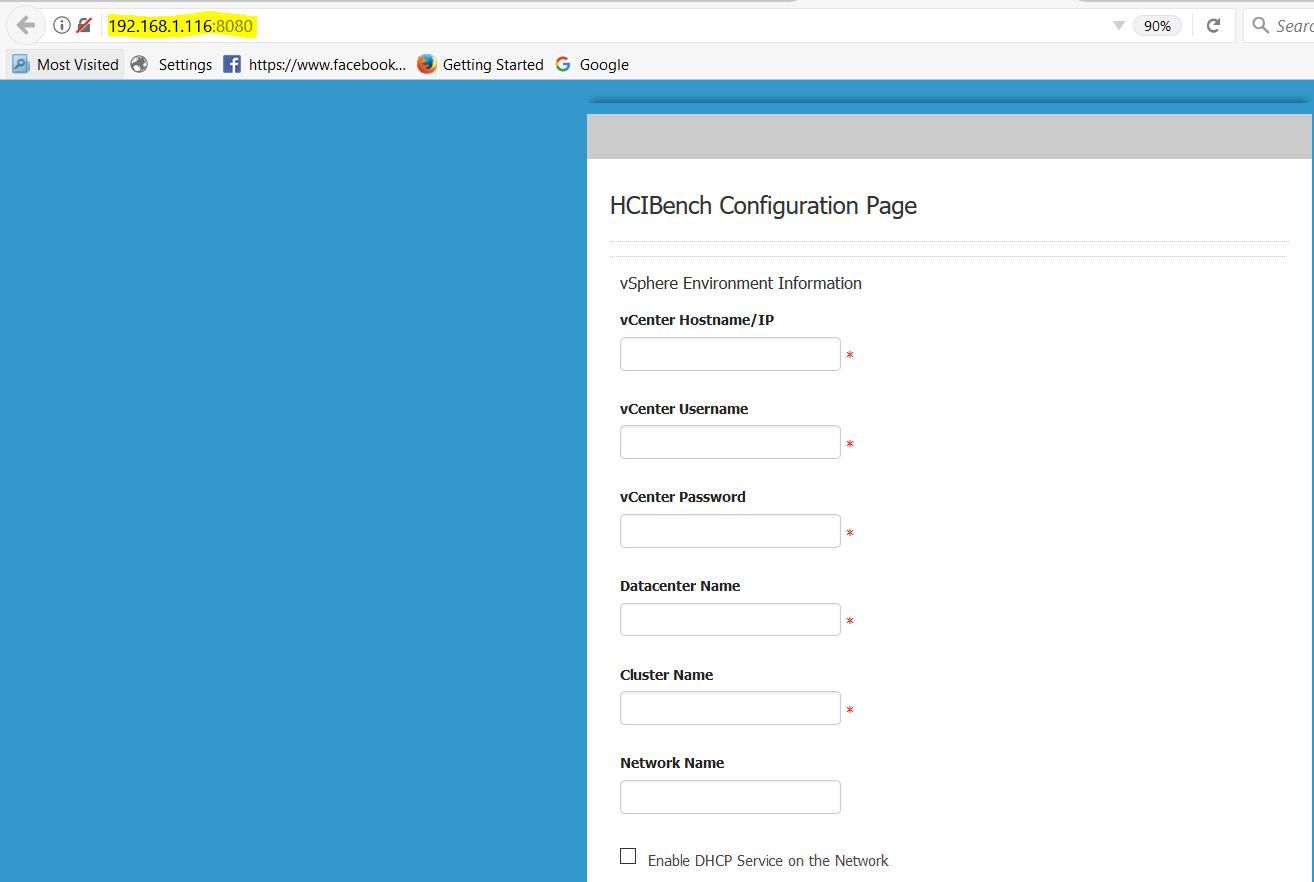
  • Go down the whole list and fill in each field. The screen-print shows half the configuration
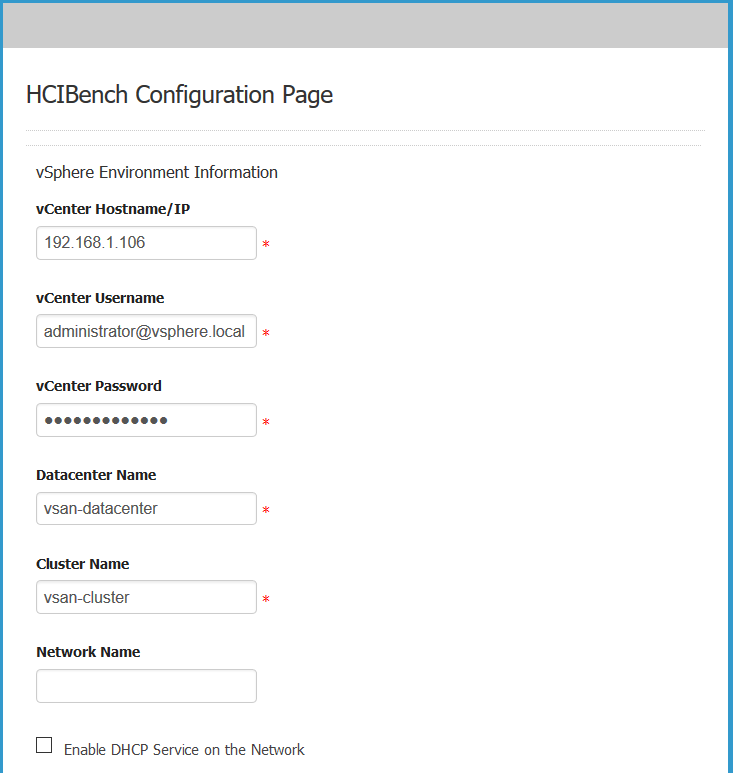
  • Fill in the vCenter IP or FQDN
  • Fill in the vCenter Username as username@domain format
  • Fill in the Center Password
  • Fill in your Datacenter Name
  • Fill in your Cluster Name
  • Fill in the network name. If you don’t fill anything in here, it will assume the “VM Network” Note: This is my default network so I left it blank.
  • You’ll see a checkbox for enabling DHCP Service on the network. DHCP is required for all the Vdbench worker VMs that HCIBench will produce so if you don’t have DHCP on this network, you will need to check this box so it will assign addresses for you. As before I have a Windows DHCP server on my network so I won’t check this.

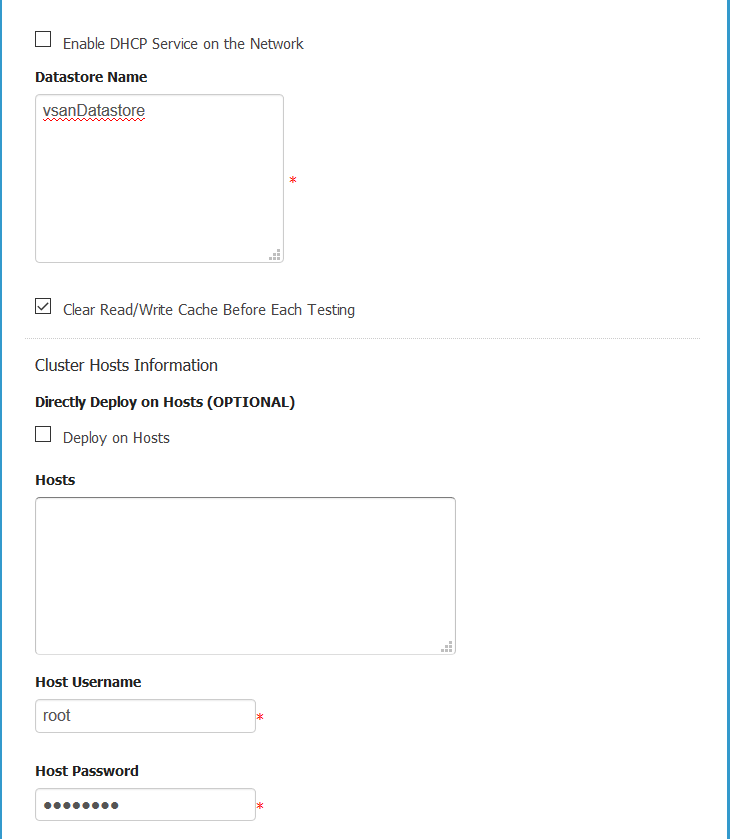
  • Next enter the Datastore name of the datastore you want HCIBench to test so for example I am going to put in vsanDatastore which is the name of my vSAN.
  • Select Clear Read/Write Cache Before Each Testing which will make sure that test results are not skewed by any data lurking in the cache. It is designed to flush the cache tier prior to testing.
  • Next you have the option to deploy the worker VMs directly to the hosts or whether HCIBench should leverage vCenter

If this parameter is unchecked, ignore the Hosts field below, for the Host Username/Password fields can also be ignored if Clear Read/Write Cache Before Each Testing is unchecked. In this mode, a Vdbench Guest VM is deployed by the vCenter and then is cloned to all hosts in the vSAN Cluster in a round-robin fashion. The naming convention of Vdbench Guest VMs deployed in this mode is
“vdbench-vc-<DATASTORE_NAME>-<#>”.
If this parameter is checked, all the other parameters except EASY RUN must be specified properly.
The Hosts parameter specifies IP addresses or FQDNs of hosts in the vSAN Cluster to have Vdbench Guest VMs deployed, and all these hosts should have the same username and password specifed in Host Username and Host Password. In this mode, Vdbench Guest VMs are deployed directly on the specified hosts concurrently. To reduce the network traffic, five hosts are running deployment at the same time then it moves to the next five hosts. Each host also deploys at an increment of five VMs at a time.

The naming convention of test VMs deployed in this mode is “vdbench-<HOSTNAME/IP>-<DATASTORE_NAME>-batch<VM#>-<VM#>”.

In general, it is recommended to check Deploy on Hosts for deployment of a large number of testVMs. However, if distributed switch portgroup is used as the client VM network, Deploy on Hosts must be unchecked.
EASY RUN is specifically designed for vSAN user, by checking this, HCIBench is able to handle all the configurations below by identifying the vSAN configuration. EASY RUN helps to decide how many client VMs should be deployed, the number and size of VMDKs of each VM, the way of preparing virtual disks before testing etc. The configurations below will be hidden if this option is checked.

  • You can omit all the host details and just click EASYRUN

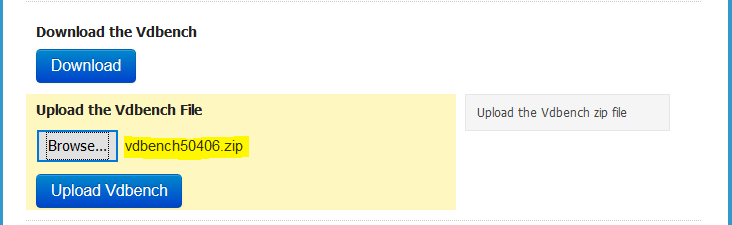
  • Next Download the vDBench zip file and upload it as it is. Note: you will need to create yourself an Oracle account if you do not have one.

  • It should look like this. Click Upload

  • Click Save Configuration

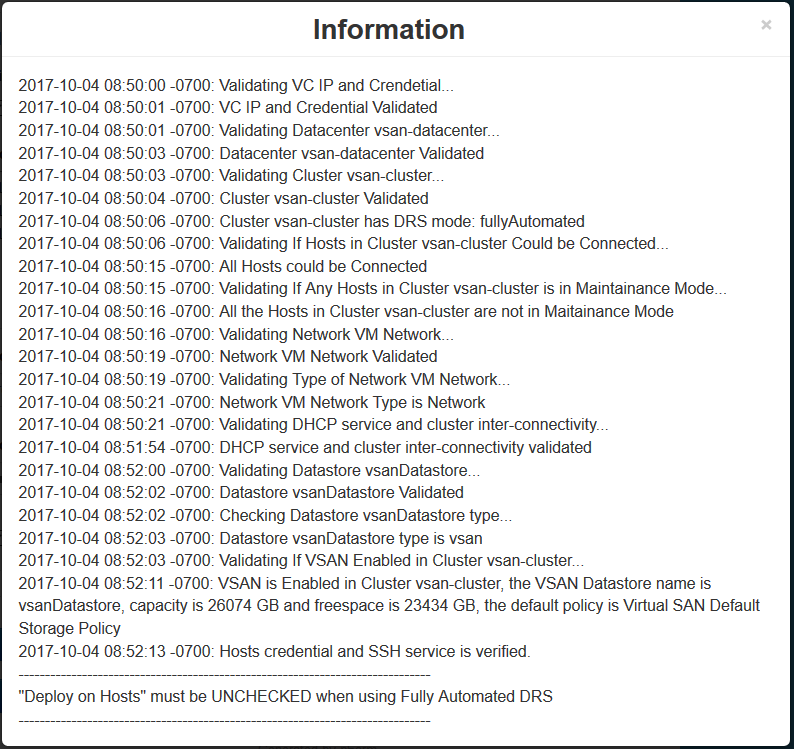
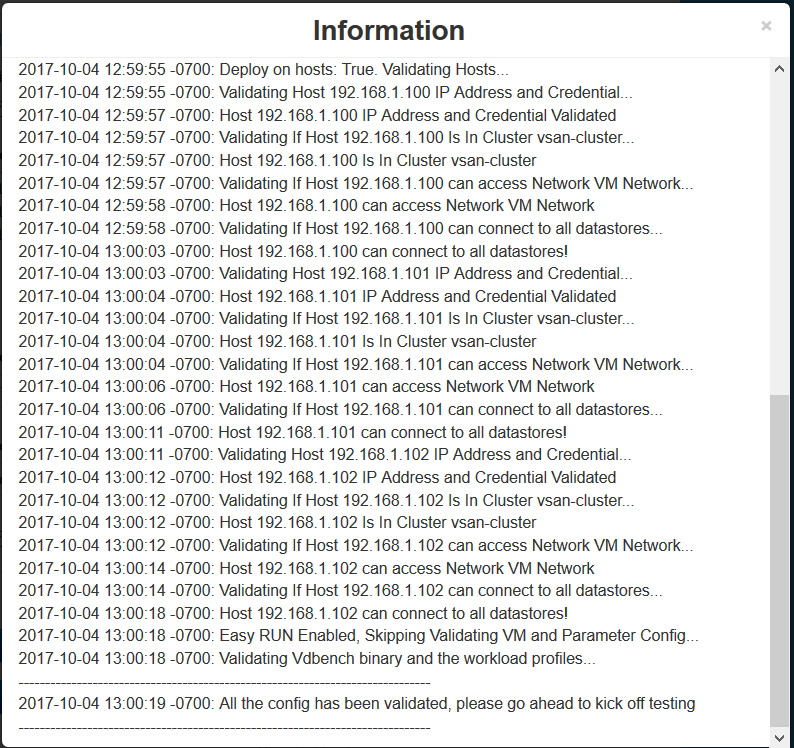
  • Click Validate the Configuration.Note at the bottom, it is saying to “Deploy on hosts must be unchecked” when using fully automated DRS. As a result I changed my cluster DRS settings to partially automated and then I got the correct message below when I validated again.

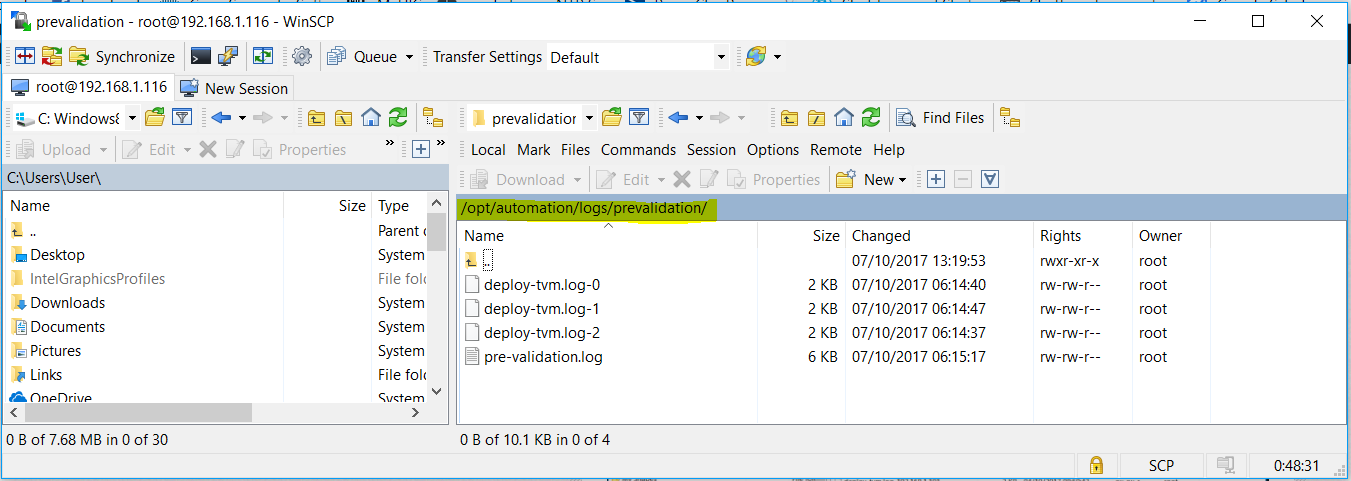
  • If you get any issues, please look at the Pre-validation logs located here – /opt/automation/logs/prevalidation

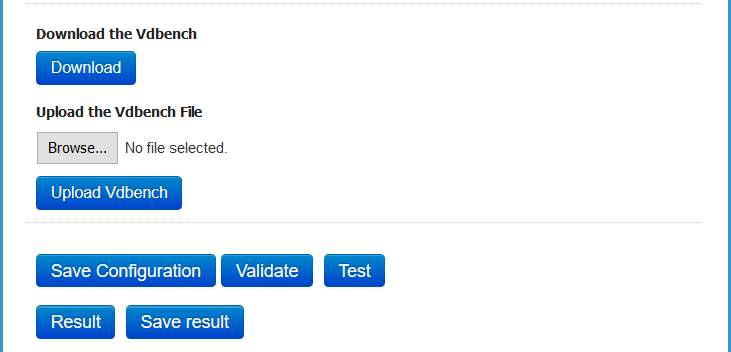
  • Next we can start a Test. Click Test

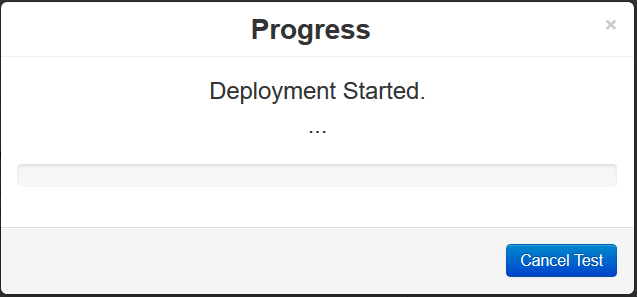
  • You will see the VMs being deployed in vCenter

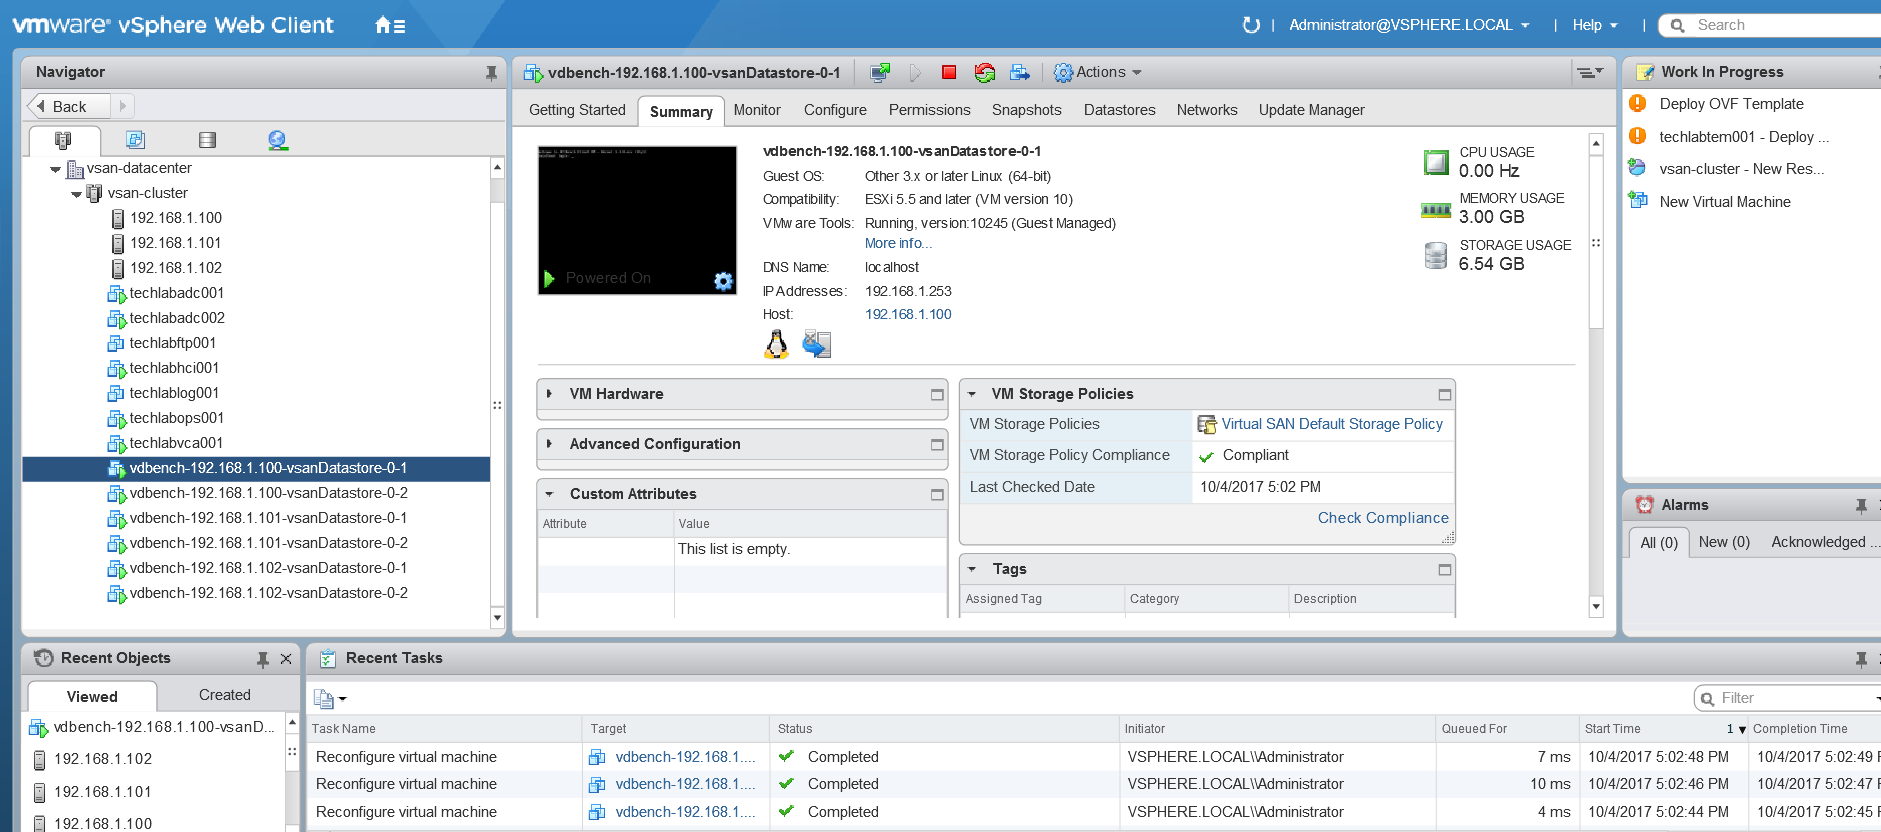
  • And more messages being shown

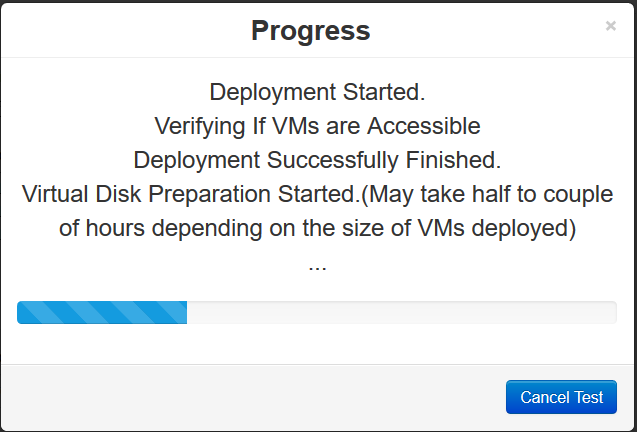
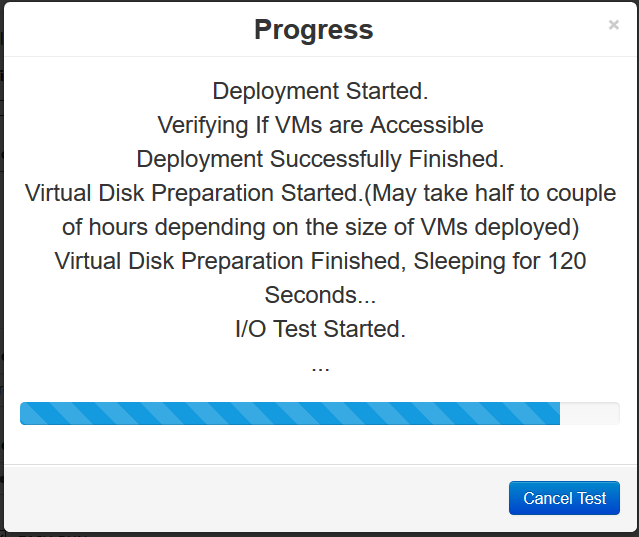
  • It should finish and say Test is finished

Results

  • Just as a note after the first test, it is worth checking that the Vms are spread evenly across all the hosts you are testing!
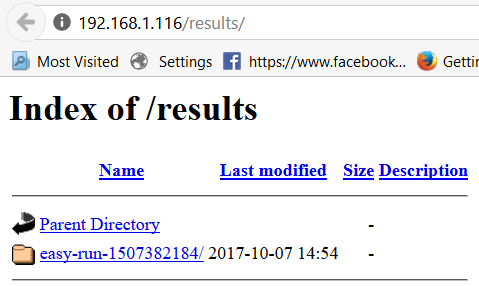
  • After the Vdbench testing finishes, the test results are collected from all Vdbench instances in the test VMs. And you can view the results at http://HCIBench_IP/results in a web browser and/or clicking the results button from the testing window.
  • You can also click Save Result and save a zip file of all the results
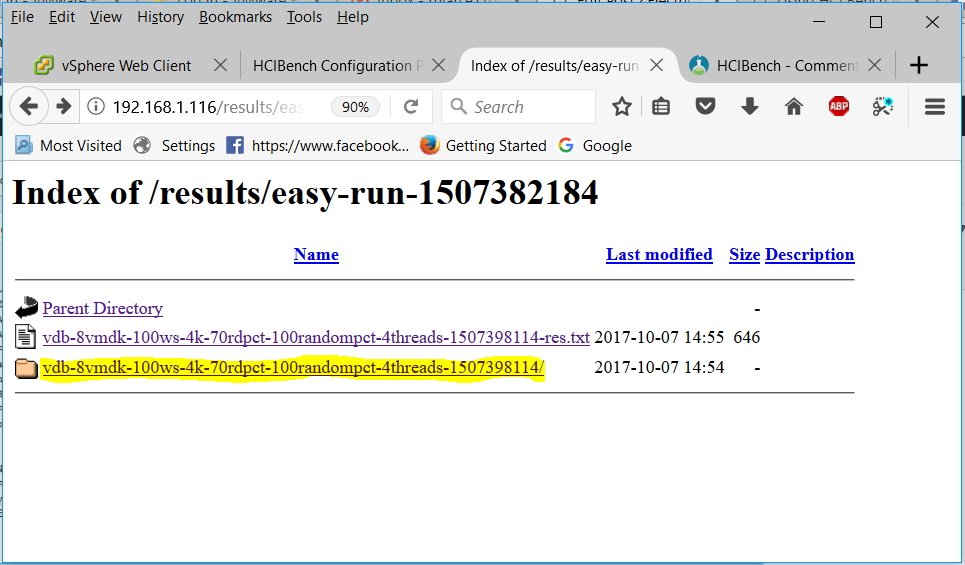
  • Click on the easy-run folder

  • Click on the .txt file

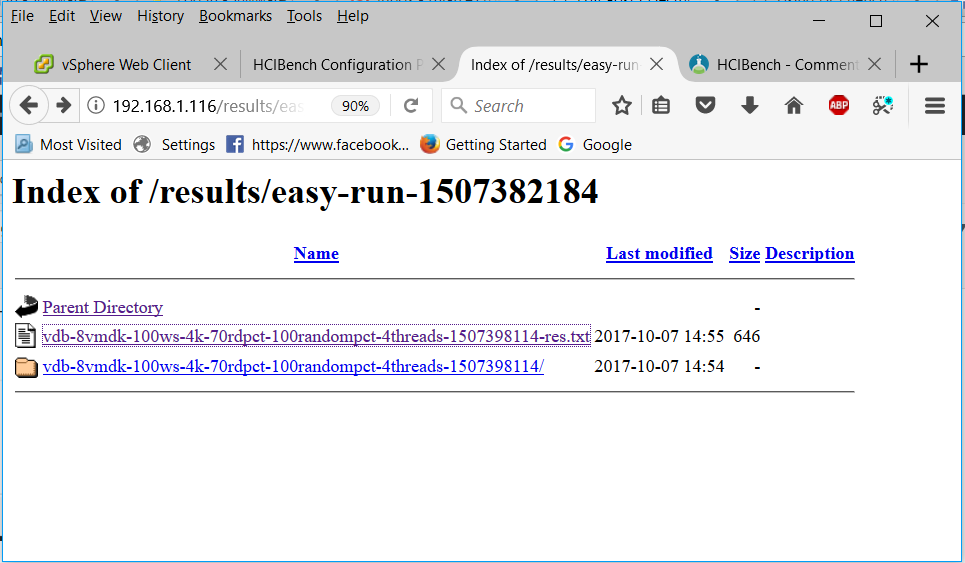
  • You will get a summarized results file

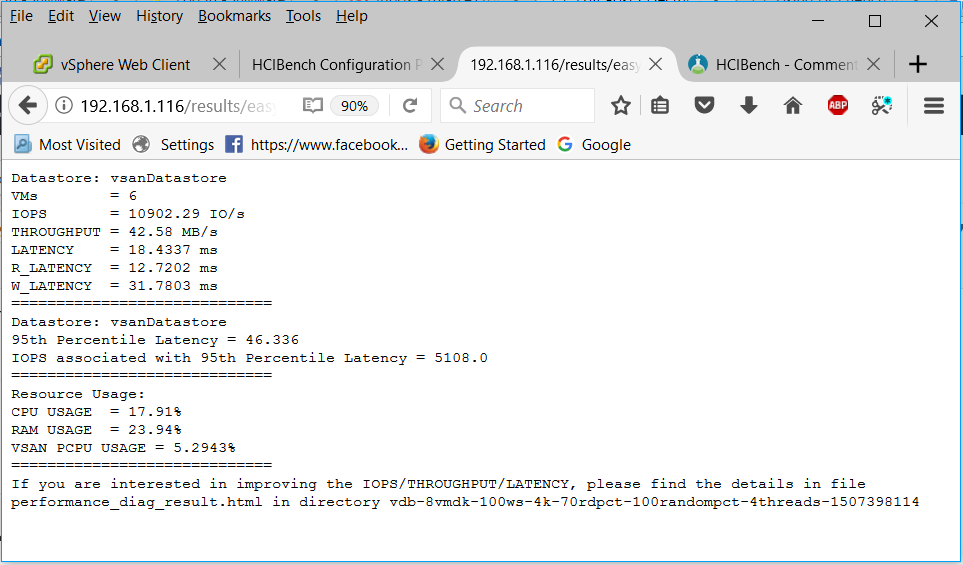
  • Just as a note in the output above, the 95th Percentile Latency can help the user to understand that during 95% of the testing time, the average latency is below 46.336ms
  • Click on the other folder

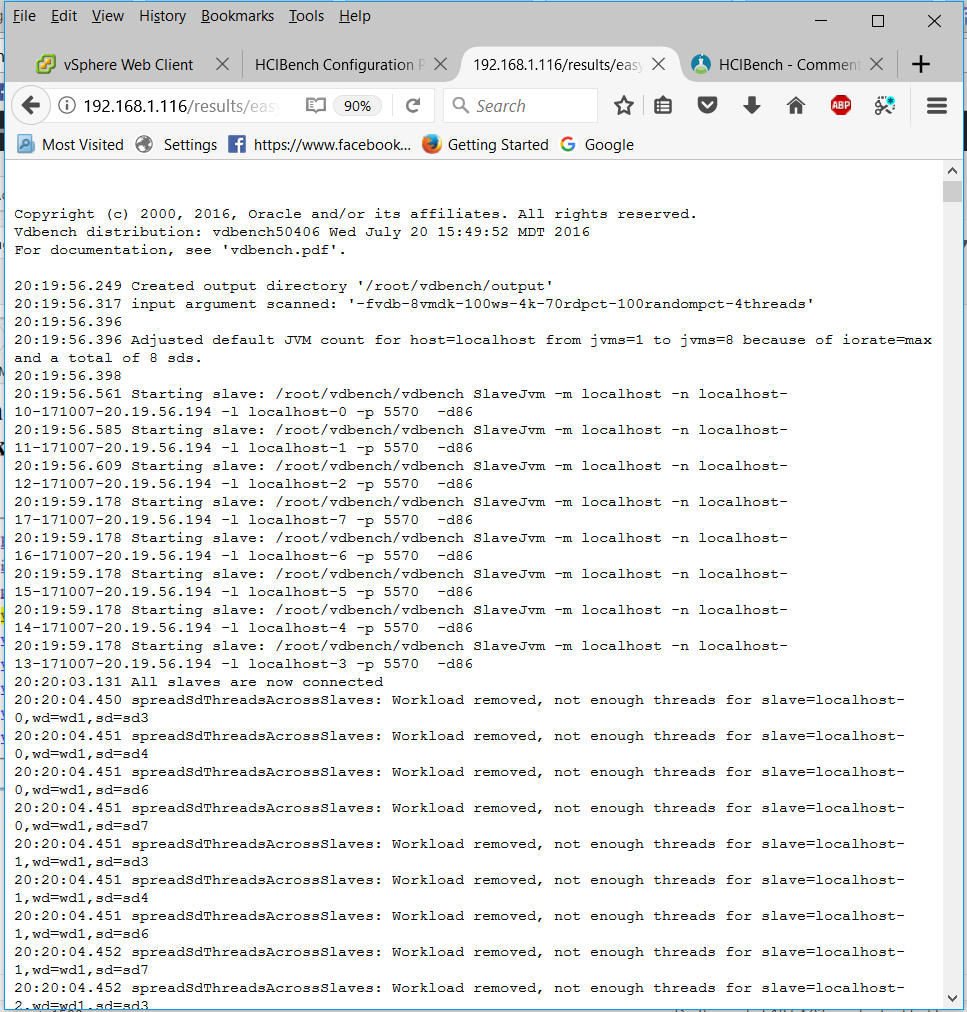
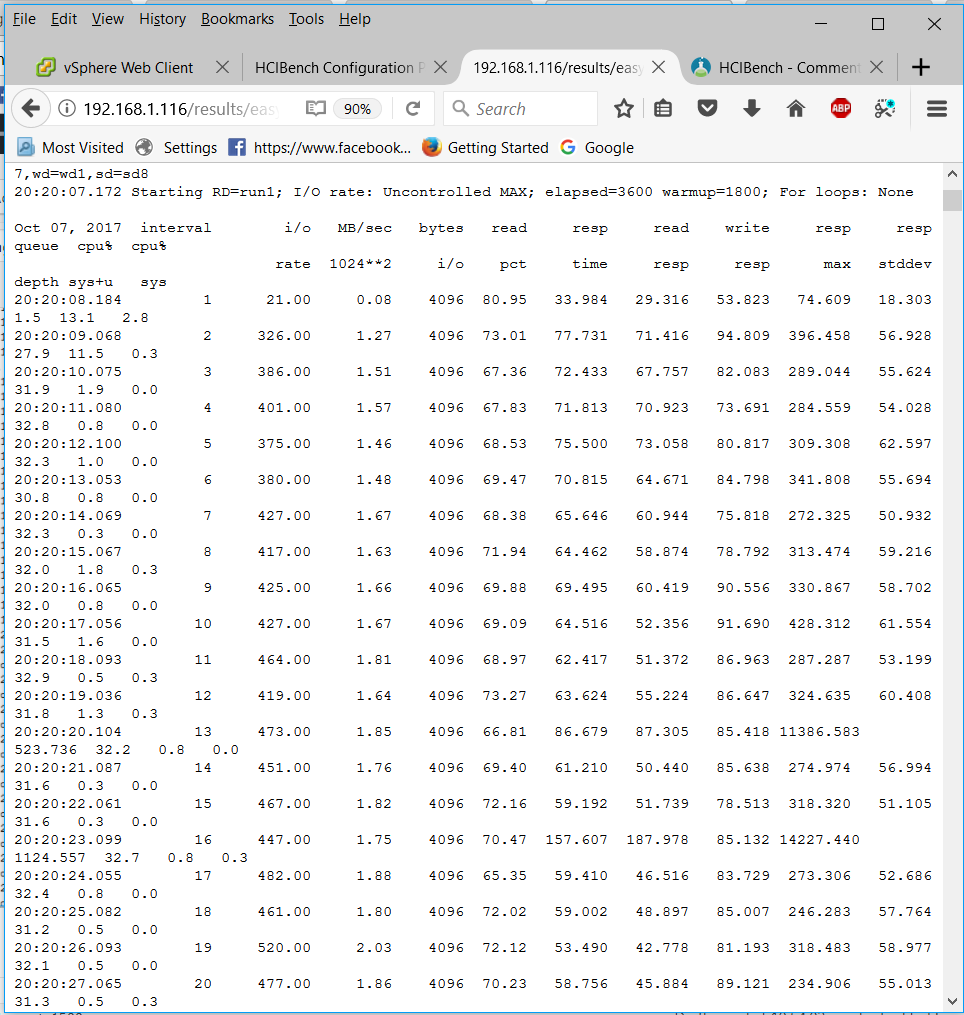
  • You can also see the individual vdBench VMs statistics by clicking on

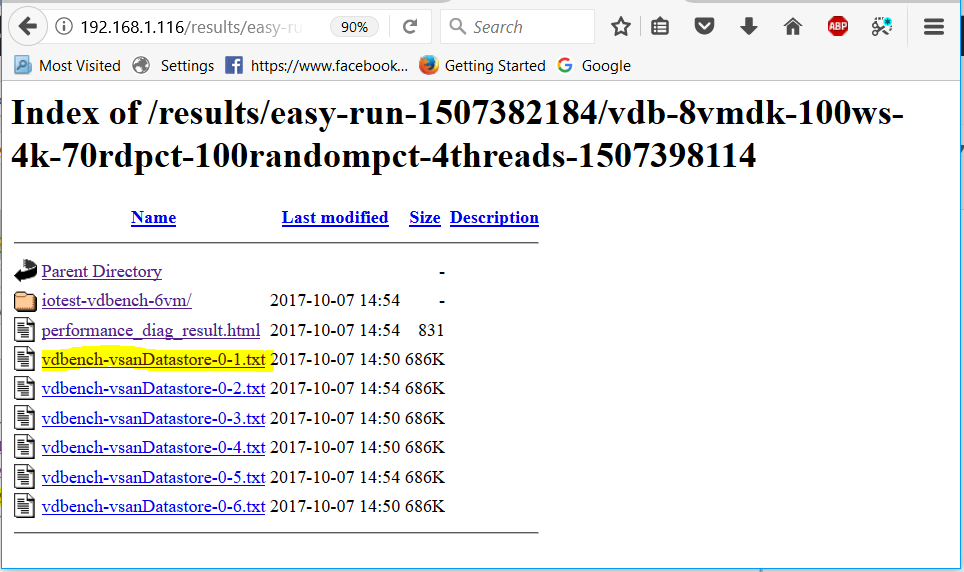
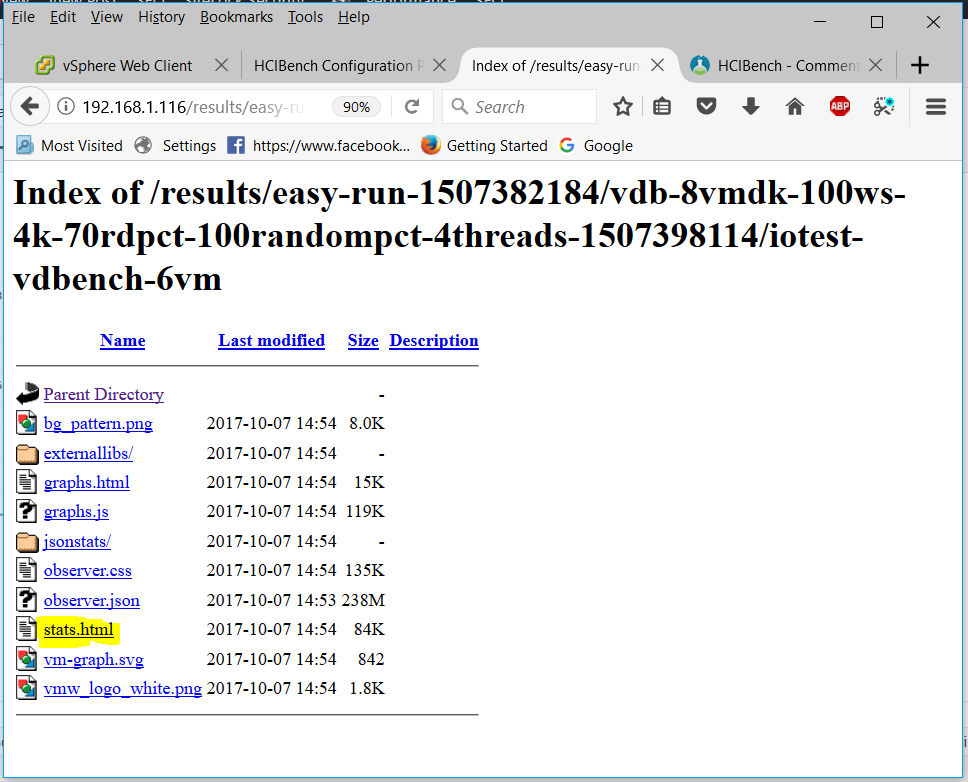
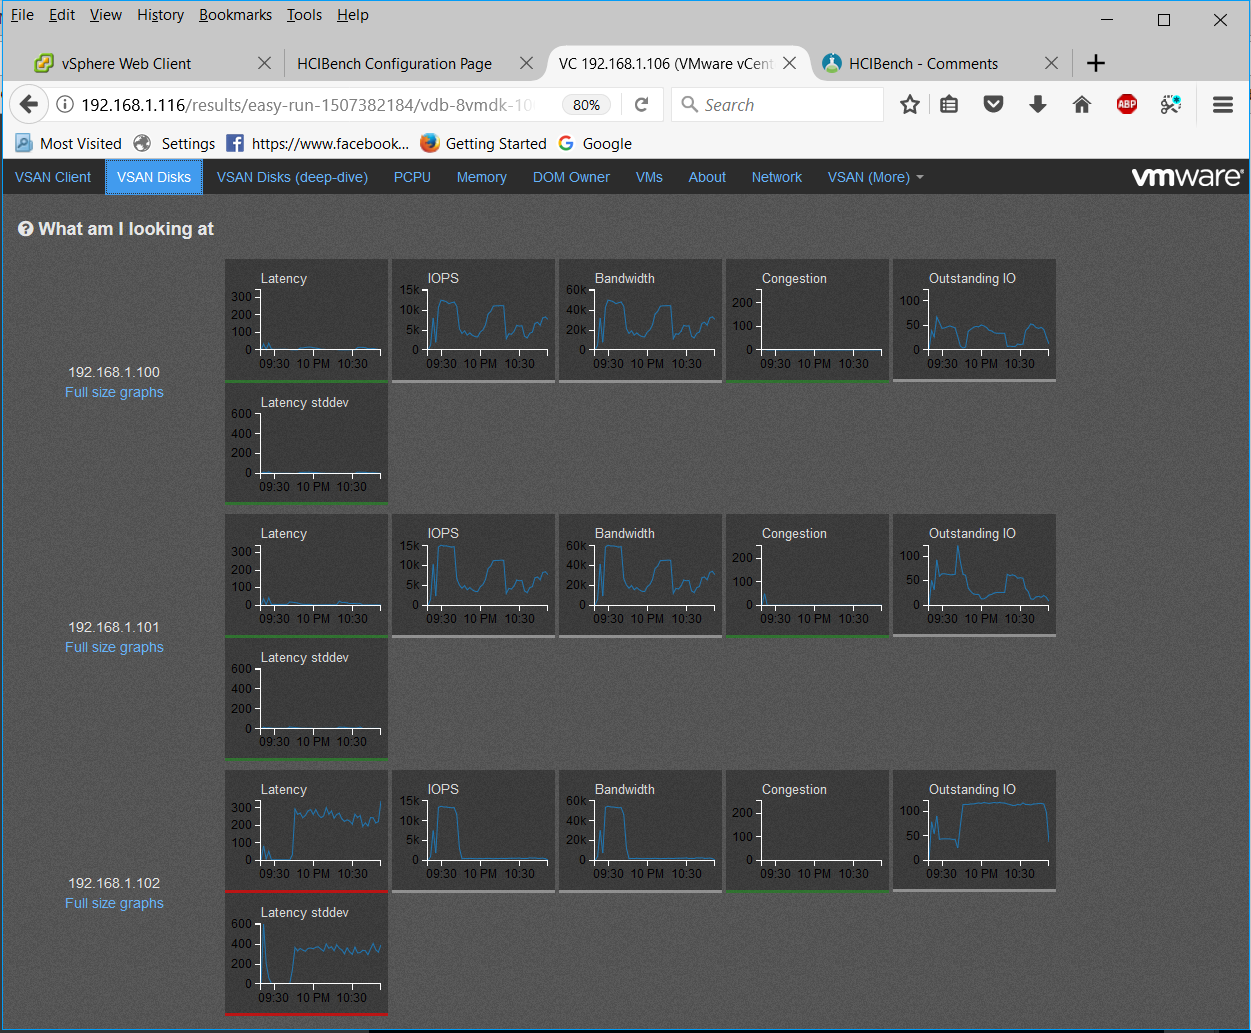
  • You can also navigate down to what is a vSAN Observer collection. Click on the stats.html file to display a vSAN Observer view of the cluster for the period of time that the test was running

  • You will be able to click through the tabs to see what sort of performance, latency and throughput was occurring.

  • Enjoy and check you are getting the results you would expect from your storage
  • The results folder holds 200GB results so you may need to delete some results if it gets full. Putty into the appliance, go to /opt/output/results and you can use rm -Rf “filename”

Useful Links

  • Comments from the HCIBench fling site which may be useful for troubleshooting

https://labs.vmware.com/flings/hcibench/comments

  • If you have questions or need help with the tool, please email VSANperformance@vmware.com
  • Information about the back-end scripts in HCIBench thanks to Chen Wei

Use HCIBench Like a Pro – Part 2

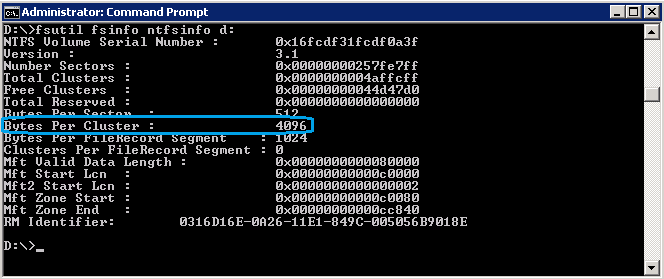
An interesting point about VMs and O/S alignment – Do we still need this on vSAN and are there performance impacts?

VMware Virtual SAN and Block Alignment


Understanding CPU Ready Time in VMware 5.x

clock

General Rules for Processor Scheduling

  1. ESX(i) schedules VMs onto and off of processors as needed
  2. Whenever a VM is scheduled to a processor, all of the cores must be available for the VM to be scheduled or the VM cannot be scheduled at all
  3. If a VM cannot be scheduled to a processor when it needs access, VM performance can suffer a great deal.
  4. When VMs are ready for a processor but are unable to be scheduled, this creates what VMware calls the CPU % Ready values
  5. CPU % Ready manifests itself as a utilisation issue but is actually a scheduling issue
  6. VMware attempts to schedule VMs on the same core over and over again and sometimes it has to move to another processor. Processor caches contain certain information that allows the OS to perform better. If the VM is actually moved across sockets and the cache isn’t shared, then it needs to be loaded with this new info.
  7. Maintain consistent Guest OS configurations

Monitoring CPU Ready Time

CPU Ready Time is the time that the VM waits in a ready-to-run state (meaning it has work to do) to be scheduled on one or more of the physical CPUs by the hypervisor. It is generally normal for VMs to have small values for CPU Ready Time accumulating even if the hypervisor is not over subscribed or under heavy activity, it’s just the nature of shared scheduling in virtualization. For SMP VMs with multiple vCPUs the amount of ready time will generally be higher than for VMs with fewer vCPUs since it requires more resources to schedule/co-schedule the VM when necessary and each of the vCPUs accumulates the time separately.

There are 2 ways to monitor CPU Ready times.

  • esxtop/resxtop
  • Performance Overview Charts in vCenter

ESXTOP/RESXTOP

  • Open Putty and log into your host. Note: You may need to enable SSH in vCenter for the hosts first
  • Type esxtop
  • Press c for CPU
  • Press V for Virtual Machine view

esxtopcpu

  • %USED – (CPU Used time) % of CPU used at current time.  This number is represented by 100 X Number_of_vCPU’s so if you have 4 vCPU’s and your %USED shows 100 then you are using 100% of one CPU or 25% of four CPU’s.
  • %RDY – (Ready) % of time a vCPU was ready to be scheduled on a physical processor but could not be due to contention.  You do not want this above 10% and should look into anything above 5%.
  • %CSTP – (Co-Stop) % in time a vCPU is stopped waiting for access to physical CPU high numbers here represent problems.  You do not want this above 5%
  • %MLMTD – (Max Limited) % of time vmware was ready to run but was not scheduled due to CPU Limit set (you have a limit setting)
  • %SWPWT – (Swap Wait) – Current page is swapped out

Performance Monitor in vCenter

If you are looking at the Ready/Summation data in the perf chart below for the CPU Ready time, converting it to a CPU Ready percent value is what provides the proper meaning to the data for understanding whether or not it is actually a problem. However, keep in mind that other configuration options like CPU Limits can affect the accumulated CPU Ready time and other VMs vCPU configuration on the same host should be checked as well as it is not good to have VMs with large amounts of vCPUs running on a host with VMs with single vCPUs

cpuready

To convert between the CPU ready summation value in vCenter’s performance charts and the CPU ready % value that you see in esxtop, you must use a formula. At one point VMware had a recommendation that anything over 5% ready time per vCPU was something to monitor
The formula requires you to know the default update intervals for the performance charts.

These are the default update intervals for each chart:

Realtime:20 seconds
Past Day: 5 minutes (300 seconds)
Past Week: 30 minutes (1800 seconds)
Past Month: 2 hours (7200 seconds)
Past Year: 1 day (86400 seconds)

To calculate the CPU ready % from the CPU ready summation value, use this formula:
(CPU summation value / (<chart default update interval in seconds> * 1000)) * 100 = CPU ready %

Example from the above chart for one day: The Realtime stats for the VM gte19-accal-rds with an average CPU ready summation value of 359.105.

(359.105 / (20s * 1000)) * 100 = 1.79% CPU ready

Useful Link

http://kb.vmware.com/selfservice/microsites/search.do?language=en_US&cmd=displayKC&externalId=2002181

Other options to check if you think you have a CPU issue

  • Verify that VMware Tools is installed on every virtual machine on the host.
  • Compare the CPU usage value of a virtual machine with the CPU usage of other virtual machines on the host or in the resource pool. The stacked bar chart on the host’s Virtual Machine view shows the CPU usage for all virtual machines on the host.
  • Determine whether the high ready time for the virtual machine resulted from its CPU usage time reaching the CPU limit setting. If so, increase the CPU limit on the virtual machine.
  • Increase the CPU shares to give the virtual machine more opportunities to run. The total ready time on the host might remain at the same level if the host system is constrained by CPU. If the host ready time doesn’t decrease, set the CPU reservations for high-priority virtual machines to guarantee that they receive the required CPU cycles.
  • Increase the amount of memory allocated to the virtual machine. This action decreases disk and or network activity for applications that cache. This might lower disk I/O and reduce the need for the host to virtualize the hardware. Virtual machines with smaller resource allocations generally accumulate more CPU ready time.
  • Reduce the number of virtual CPUs on a virtual machine to only the number required to execute the workload. For example, a single-threaded application on a four-way virtual machine only benefits from a single vCPU. But the hypervisor’s maintenance of the three idle vCPUs takes CPU cycles that could be used for other work.
  • If the host is not already in a DRS cluster, add it to one. If the host is in a DRS cluster, increase the number of hosts and migrate one or more virtual machines onto the new host.
  • Upgrade the physical CPUs or cores on the host if necessary.
  • Use the newest version of hypervisor software, and enable CPU-saving features such as TCP Segmentation Offload, large memory pages, and jumbo frames.

Identify vCenter server performance chart metrics related to Memory and CPU

images

Use the vSphere vCenter Performance Charts to monitor Memory usage and CPU usage of clusters, hosts, virtual machines, and vApps. Really useful statistics in blue

Host Memory

HOST MEM

VM Memory

VM MEM

Host CPU

Host CPU

VM CPU

VM CPU

Iometer

What is Iometer?

Iometer is an I/O subsystem measurement and characterization tool for single and clustered systems. It is used as a benchmark and troubleshooting tool and is easily configured to replicate the behaviour of many popular applications. One commonly quoted measurement provided by the tool is IOPS

Iometer can be used for measurement and characterization of:

  • Performance of disk and network controllers.
  • Bandwidth and latency capabilities of buses.
  • Network throughput to attached drives.
  • Shared bus performance.
  • System-level hard drive performance.
  • System-level network performance.

Documentation

http://iometer.cvs.sourceforge.net/*checkout*/iometer/iometer/Docs/Iometer.pdf

http://communities.vmware.com

Downloads

http://www.iometer.org/doc/downloads.html

YouTube

Iometer Tutorial Part 1

Iometer Tutorial Part 2

Iometer Tutorial Part 2b

What are IOPs?

IOPS (Input/Output Operations Per Second, pronounced eye-ops) is a common performance measurement used to benchmark computer storage devices like hard disk drives (HDD), solid state drives (SSD), and storage area networks (SAN). As with any benchmark, IOPS numbers published by storage device manufacturers do not guarantee real-world application performance.

IOPS can be measured with applications, such as Iometer (originally developed by Intel), as well as IOzone and FIO and is primarily used with servers to find the best storage configuration.

The specific number of IOPS possible in any system configuration will vary greatly, depending upon the variables the tester enters into the program, including the balance of read and write operations, the mix of sequential and random access patterns, the number of worker threads and queue depth, as well as the data block sizes.There are other factors which can also affect the IOPS results including the system setup, storage drivers, OS background operations, etc. Also, when testing SSDs in particular, there are preconditioning considerations that must be taken into account

Performance Characteristics

The most common performance characteristics measured are sequential and random operations. Sequential operations access locations on the storage device in a contiguous manner and are generally associated with large data transfer sizes, e.g. 128 KB. Random operations access locations on the storage device in a non-contiguous manner and are generally associated with small data transfer sizes, e.g. 4 KB.

The most common performance characteristics are as follows

Installing and Configuring Iometer

  • Click on the .exe

  • Click Next

  • Click I agree

  • Click Next

  • Click Install

  • Click Finish
  • You should see everything installed as per below

  • Open Iometer AS AN ADMINISTRATOR. (not running as Administrator means you don’t see any drives)
  • Accept License
  • The Iometer GUI appears, and Iometer starts one copy of Dynamo on the same machine.

  • Click on the name of the local computer (Manager)in the Topology panel on the
    left side of the Iometer window. The Local Computer (Manager’s) available disk drives appear in the Disk Targets tab. Blue icons represent physical drives; they are only shown if they have no partitions on them. Yellow icons represent logical (mounted) drives; they are only shown if they are writable. A yellow icon with a red slash through it means that the drive needs to be prepared before the test starts
  • Disk workers access logical drives by reading and writing a file called iobw.tst in the root directory of the drive. If this file exists, the drive is shown with a plain yellow icon; if the file does not exist, the drive is shown with a red slash through the icon. (If this file exists but is not writable, the drive is considered read-only and is not shown at all.)
  • If you select a drive that does not have an iobw.tst file, Iometer will begin the test by creating this file and expanding it until the drive is full

  •  The Disk Targets tab lets you see and control the disks used by the disk worker(s currently selected in the Topology panel. You can control which disks are used, how much of each disk is used, the maximum number of outstanding I/Os per disk for each worker, and how frequently the disks are opened and closed.
  • You can select any number of drives; by default, no drives are selected. Click on a single drive to select it; Shift-click to select a range of drives; Control-click to add a drive to or remove a drive from the current selection

  • The Worker underneath your Machine Name – This will default to one worker (thread) for each physical or virtual  processor on the system.  In the event that Iometer is being used to  compare native to virtual performance, make sure that the worker numbers  match!
  • The Maximum Disk Size control specifies how many disk sectors are used by the
    selected worker(s). The default is 0, meaning the entire disk. Then the important part is to fill in the Maximum Disk Size. If you don’t do this, then the first time you run a test, the program will attempt to fill the entire drive with its test file!
  • You want to create a file which is much larger than the amount of RAM in your system however sometimes this is not practical if you have servers that are 24GB or 32GB etc
  • Please use the following link www.unitconversion.org/data-storage/blocks-to-gigabytes-conversion.html to get a proper conversion of blocks to GBs for a correct figure to put in Maxim Disk size
  • E.g. 1GB = 2097152
  • E.g. 5GB = 10485760
  • E.g. 10GB = 20971520
  • The Starting Disk Sector control specifies the lowest-numbered disk sector used by the selected worker(s) during the test. The default is 0, meaning the first 512-byte sector in the disk
  • The # of Outstanding I/Os control specifies the maximum number of outstanding asynchronous I/O operations per disk the selected worker(s) will attempt to have active at one time. (The actual queue depth seen by the disks may be less if the operations complete very quickly.) The default value is 1 but if you are using a VM, you can set this to the queue depth value which could be 16 or 32
    Note that the value of this control applies to each selected worker and each selected disk. For example, suppose you select a manager with 4 disk workers in the Topology panel, select 8 disks in the Disk Targets tab, and specify a # of Outstanding I/Os of 16. In this case, the disks will be distributed among the workers (2 disks per worker), and each worker will generate a maximum of 16 outstanding I/Os to each of its disks. The system as a whole will have a maximum of 128 outstanding I/Os at a time (4 workers * 2 disks/worker * 16 outstanding I/Os per disk) from this manager
  • For all Iometer tests, under “Disk Targets” always increase the “# of  Outstanding I/Os” per target.  When left at the default value of ‘1′, a  relative low load will be placed on the array.  By increasing this  number some the OS will queue up multiple requests and really saturate  the storage.  The ideal number of outstanding IOs can be determined by  running the test multiple times and increasing this number all the  while.  At some point IOPS will stop increasing.  Generally an increase  in return diminishes around 16 IOs/target but certainly more than 32  IOs/target will have no value due to the default queue depth in ESX

iometer99

Note: If the total number of outstanding I/Os in the system is very large, Iometer or Windows may hang, thrash, or crash. The exact value of “very large” depends on the disk driver and the amount of physical memory available. This problem is due to limitations in Windows and some disk drivers, and is not a problem with the Iometer software. The problem is seen in Iometer and not in other applications because Iometer makes it easy to specify a number of outstanding I/Os that is much larger than typical applications produce.

  • The Test Connection Rate control specifies how often the worker(s) open and close their disk(s). The default is off, meaning that all the disks are opened at the beginning of the test and are not closed until the end of the test. If you turn this control on, you can specify a number of transactions to perform between opening and closing. (A transaction is an I/O request and the corresponding reply, if any

  • Click on Access Specifications
  • Check the table below for recommendations

iometer1

  • Click on Access Specifications.

  • There is an Access Specification called “All in One” spec that’s included with IOmeter. This spec includes all block sizes at varying levels of randomness and can provide a good baseline for server comparison

iometer2

  • You can assign a series of targeted tests that get executed in sequential order under the “Assigned Access Specifications” panel.  You can use existing IO scenarios or define your own custom access scenario. I am going to assign the “4K; 100% Read; 0% Random” specification by selecting it and clicking the “Add” button.  This scenario is self-explanatory, and is generally useful for generating a tremendous amount of IO since your read pattern is optimal and the blocks are small.
  • The default is 2-Kilobyte random I/Os with a mix of 67% reads and 33% writes,
    which represents a typical database workload
  • For maximum throughput (Megabytes per second), try changing the Transfer
    Request Size to 64K, the Percent Read/Write Distribution to 100% Read, and
    the Percent Random/Sequential Distribution to 100% Sequential.
  • For the maximum I/O rate (I/O operations per second), try changing the
    Transfer Request Size to 512 bytes, the Percent Read/Write Distribution to
    100% Read, and the Percent Random/Sequential Distribution to 100%
    Sequential.
  • If you want to check what block size your O/S is using, try typing the below into a command prompt and look at the value for byes per cluster

blocksize

  • Note the below relation between block size and bandwidth

Capture

  • Next Click on Results Display

  • This tab will display your test results real-time once the test has finished.  Leave the radio button for “Results Since” set to “Start of Test” as it averages the results as they roll in.
  • Obtaining run-time statistics affects the performance of the system. When running a significant test series, the Update Frequency slider should be set to “oo” (infinity). Also, you should be careful not to move the mouse or to have any background processes (such as a screensaver or FindFast) running while testing, to avoid unnecessary CPU utilization and interrupts.
  • Set the “Update Frequency” to 2 or 3 seconds.  Don’t set it too low as it is possible to affect the test negatively if it is borrowing CPU cycles to keep Iometer updated.  While running you will see activity in the “Display” panel at the frequency you set.
  •  The three most important indicators are “Total I/Os per Second”, “Total MBs per Second”, and “Average I/O Response Time (ms)”.
  • Total I/Os indicate the current number of operations occurring against your storage target.
  • MBs per Second is a function of <I/Os> * <block size>.  This indicates the amount of data your storage target is reading per second.
  • One thing is for certain, that you don’t want to see any errors.  You have another serious issue if that is what you are seeing
  • Go to Test Setup

  • The “Test Description” is used as an identifier in the output report if you select that option.
  • “Run Time” is something you can adjust.  There are no strict rules regulating this setting.  The longer you run your test the more accurate your results.  You system may have unexpected errors or influences so extending your test a bit will flatten  out any anomalies.  If it is a production test run it for 20 – 60 minutes. There’s all sorts of ram caching whatever going on, so it reports falsely high for a while. If you watch it run, you’ll see it start off reporting very large numbers, and they slowly get smaller, and smaller, and smaller. Don’t pay any attention to the numbers until they stabilize, might be 30+ minutes.
  • “Ramp Up Time” is a useful setting as it allows the disks to spin up and level out the internal cache for a more consistent test result.  Set this between 10 seconds and 1 minute.
  • “Record Results” is used when you would like to produce a test report following the test.  Set it to “None” if you only wish to view the real-time results.  You can accept the defaults for “Number of Workers to Spawn Automatically”.
  • “Cycling Options” gives one the choice to increment Workers, Targets, and Outstanding I/Os while testing.  This is useful in situations where you are uncertain how multiple CPU threads, multiple storage targets, and queue depth effect outcome.  Do experiment with these parameters, especially the Outstanding I/Os (Queue Depth).  Sometimes this is OS dependent and other times it is hardware related.  Remember you can set the “Outstanding I/Os” under the “Disk Targets” tab.  In this test we are going to take the default. the choice to increment Workers, Targets, and Outstanding I/Os while testing.  This is useful in situations where you are uncertain how multiple CPU threads, multiple storage targets, and queue depth effect outcome.
  • Next, now that everything is set, click the Green Flag button at the top to start the test.  Following the Ramp Up time (indicated in the status bar) you will begin to see disk activity

  • It will prompt you to select a location to save your .csv
  • While the tests are running, you will see the below

  • You can expand a particular result into its own screen by pressing the right-arrow at the right of each test, which results in a screen similar to the one shown below

To test network performance between two computers (A and B)

  • On computer A, double-click on Iometer.exe. The Iometer main window appears and a Dynamo workload generator is automatically launched on computer A.
  • On computer B, open an MS-DOS Command Prompt window and execute Dynamo, specifying computer A’s name as a command line argument.
  • For example: C:\> dynamo computer_a
  • On computer A again, note that computer B has appeared as a new manager in the Topology panel. Click on it and note that its disk drives appear in the Disk Targets tab.
  • With computer B selected in the Topology panel, press the Start Network Worker button (picture of network cables). This creates a network server on computer B.
  • With computer B still selected in the Topology panel, switch to the Network Targets tab, which shows the two computers and their network interfaces. Select one of computer A’s network interfaces from the list. This creates a network client on computer A and connects the client and server together.
  • Switch to the Access Specifications tab. Double-click on “Default” in the Global Access Specifications list. In the Edit Access Specification dialog, specify a Transfer Request Size of 512 bytes. Press OK to close the dialog.
  • Switch to the Results Display tab. Set the Update Frequency to 10 seconds.
  • Press the Start Tests button. Select a file to store the test results. If you specify an existing file, the new results will be appended to the existing ones.
  • Watch the results in the Results Display tab.
  • Press the Stop Test button to stop the test and save the results.

Useful Powerpoint Presentation

Texas Systems Storage Presentation

Brilliant Iometer Results Analysis

http://blog.open-e.com/random-vs-sequential-explained/

VMware vSphere Performance Resolution Cheat Sheet

Key Windows Performance Counters, Info and Limits

Key Windows Performance Counters, Info and Limits

Counter

Description

What to watch for

Logical Disk\% Free Space Measures the percentage of free space of the selected Logical Disk If it is below 15% then you run the risk of running out of space to store critical O/S files
PhysicalDisk\Idle Time Measures the percentage of time the disk was idle during the sample interval If this value falls below 20% the disk system is said to be saturated and you should install a faster disk system
PhysicalDisk\Avg. Disk Sec/Read Measures the average time in seconds to read data from the disk If this value is larger than 25 milliseconds the disk system is experiencing latencyFor SQL and Exchange the threshold is lower – 10ms
PhysicalDisk\Avg. Disk Sec/Write Measures the average time in seconds to write data from the disk If this value is larger than 25 milliseconds the disk system is experiencing latencyFor SQL and Exchange the threshold is lower – 10ms
Physical Disk\Avg Queue Length How many I/O Operations are waiting for the Hard Drive to become available If the value of the counter is larger than twice the number of disk spindles in an array then the disk may be a bottleneck
Memory\Cache Bytes Indicates the amount of memory being used for the file system cache. There will be a bottleneck if the value is greater than 300MB
Processor\%Idle Time % Idle Time is the percentage of time the processor is idle during the sample interval Below 20% and you are running at CPU saturation if this prolonged
Processor\Interrupts/sec The numbers of interrupts the processor was asked to respond to. Interrupts are generated from hardware components like hard disk controller adapters and network interface cards. A sustained value over 1000 is usually an indication of a problem. Problems would include a poorly configured drivers, errors in drivers, excessive utilization of a device (like a NIC on an IIS server), or hardware failure
Processor\%Processor Time Measures  how much time the processor actually spends working on productive threads and how often it was busy servicing requests. It actually provides a measurement of how often the system is doing nothing subtracted from 100%. This is a simpler calculation for the processor to make. The processor can never be sitting idle waiting to the next task, unlike our cashier. The CPU must always have something to do. It’s like when you turn on the computer, the CPU is a piece of wire that electric current is always running through, thus it must always be doing something. NT give the CPU something to do when there is nothing else waiting in the queue. This is called the idle thread. The system can easily measure how often the idle thread is running as opposed to having to tally the run time of each of the other process threads. Then , the counter simply subtracts the percentage from 100%. This counter is a natural choice that will give use the amount of time that this particular process spends using the processor resource.
Memory\Page Faults/sec This counter gives a general idea of how many times information being requested is not where the application (and VMM) expects it to be. The information must either be retrieved from another location in memory or from the pagefile. While a sustained value may indicate trouble here, you should be more concerned with hard page faults that represent actual reads or writes to the disk. Remember that the disk access is much slower than RAM
Memory\%Committed Bytes in use This counter indicates the total amount of memory that has been committed for the exclusive use of any of the services or processes on Windows NT. Should this value approach the committed limit, you will be facing a memory shortage of unknown cause, but of certain severe consequence.
Memory\Available Bytes This counter indicates the amount of memory that is left after nonpaged pool allocations, paged pool allocations, process’ working sets, and the file system cache have all taken their piece.
System\System Calls/sec This counter is a measure of the number of calls made to the system components, Kernel mode services. This is a measure of how busy the system is taking care of applications and services—software stuff. When compared to the Interrupts/Sec it will give you an indication of whether processor issues are hardware or software related. See Processor : Interrupts/Sec for more information
System\Threads Threads is the number of threads in the computer at the time of data collection. This is an instantaneous count, not an average over the time interval.  A thread is the basic executable entity that can execute instructions in a processor. Monitor loosely
System\Processor Queue Length Gives an indication of how many threads are waiting for execution. If this counter is consistently higher than around 5 when processor utilization approaches 100%, then this is a good indication that there is more work (active threads) available (ready for execution) than the machine’s processors are able to handle. Note that this is not always a hard and fast indicator however, for some services like IIS 6 pool and manage their own worker threads, so on a busy web server for example you would want to look at other counters like ASP\Requests Queued or ASP.NET\Requests Queued as well. Furthermore, the larger the number of active services and applications running on your server, the busier the processor queue will normally be, so on a multi-role server running near 100% utilization content may only be a significant factor once System\Processor Queue Length exceeds something like 10 instead of 5 as mentioned previously.
Network Interface : Bytes Sent/sec This is how many bytes of data are sent to the NIC. This is a raw measure of throughput for the network interface. We are really measuring the information sent to the interface which is the lowest point we can measure. If you have multiple NIC, you will see multiple instances of this particular counter. Dependent on NIC Speed
Network Interface: Bytes Received/sec. This, of course, is how many bytes you get from the NIC. This is a measure of the inbound traffic In measuring the bytes, NT isn’t too particular at this level. So, no matter what the byte is, it is counted. This will include the framing bytes as opposed to just the data Dependent on NIC Speed


Performance and Resource Monitoring in Windows Server 2008

What does Windows Reliability and Performance Monitor do?

Windows Reliability and Performance Monitor is a Microsoft Management Console (MMC) snap-in that combines the functionality of previous stand-alone tools including Performance Logs and Alerts, Server Performance Advisor, and System Monitor. It provides a graphical interface for customizing performance data collection and Event Trace Sessions.

It also includes Reliability Monitor, an MMC snap-in that tracks changes to the system and compares them to changes in system stability, providing a graphical view of their relationship

What new functionality does this feature provide?

Features of Windows Reliability and Performance Monitor new to Windows Server 2008 include the following.

Data Collector Sets

An important new feature in Windows Reliability and Performance Monitor is the Data Collector Set, which groups data collectors into reusable elements for use with different performance monitoring scenarios. Once a group of data collectors are stored as a Data Collector Set, operations such as scheduling can be applied to the entire set through a single property change.

Windows Reliability and Performance Monitor also includes default Data Collector Set templates to help system administrators begin collecting performance data specific to a Server Role or monitoring scenario immediately.

Wizards and templates for creating logs

Adding counters to log files and scheduling their start, stop, and duration can now be performed through a Wizard interface. In addition, saving this configuration as a template allows system administrators to collect the same log on subsequent computers without repeating the data collector selection and scheduling processes. Performance Logs and Alerts features have been incorporated into the Windows Reliability and Performance Monitor for use with any Data Collector Set.

Resource View

The home page of Windows Reliability and Performance Monitor is the new Resource View screen, which provides a real-time graphical overview of CPU, disk, network, and memory usage. By expanding each of these monitored elements, system administrators can identify which processes are using which resources. In previous versions of Windows, this real-time process-specific data was only available in limited form in Task Manager.

Reliability Monitor

Reliability Monitor calculates a System Stability Index that reflects whether unexpected problems reduced the reliability of the system. A graph of the Stability Index over time quickly identifies dates when problems began to occur. The accompanying System Stability Report provides details to help troubleshoot the root cause of reduced reliability. By viewing changes to the system (installation or removal of applications, updates to the operating system, or addition or modification of drivers) side by side with failures (application failures, operating system crashes, or hardware failures), a strategy for addressing the issues can be developed quickly.

Unified property configuration for all data collection, including scheduling

Whether creating a Data Collector Set for one time use or to log activity on an ongoing basis, the interface for creation, scheduling, and modification is the same. If a Data Collector Set proves to be useful for future performance monitoring, it does not need to be re-created. It can be reconfigured or copied as a template.

User-friendly diagnosis reports

Users of Server Performance Advisor in Windows Server 2003 can now find the same kinds of diagnosis reports in Windows Reliability and Performance Monitor in Windows Server 2008. Report generation time is improved and reports can be created from data collected by using any Data Collector Set. This allows system administrators to repeat reports and assess how changes have affected performance or the report’s recommendations.

Accessing Performance Monitor

Membership in the local Performance Log Users group, or equivalent, is the minimum required to complete this procedure.

To start Performance Monitor

  • Click Start, click in the Start Search box, type perfmon, and press ENTER.
  • In the navigation tree, expand Monitoring Tools, and then click Performance Monitor.

You can also use Performance Monitor to view real-time performance data on a remote computer.

Membership in the target computer’s Performance Log Users group, or equivalent, is the minimum required to complete this procedure

To view performance counters from a remote computer, the Performance Logs and Alerts firewall exception must be enabled on the remote computer. In addition, members of the Performance Log Users group must also be members of the Event Log Readers group on the remote computer

Creating Data Collection Sets

A Data Collector Set is the building block of performance monitoring and reporting in Windows Performance Monitor. It organizes multiple data collection points into a single component that can be used to review or log performance. A Data Collector Set can be created and then recorded individually, grouped with other Data Collector Set and incorporated into logs, viewed in Performance Monitor, configured to generate alerts when thresholds are reached, or used by other non-Microsoft applications. It can be associated with rules of scheduling for data collection at specific times. Windows Management Interface (WMI) tasks can be configured to run upon the completion of Data Collector Set collection.

Data Collector Sets can contain the following types of data collectors:

  • Performance counters
  • Event trace data
  • System configuration information (registry key values)

Real Time Example

  • Start Performance Monitor
  • Right-click anywhere in the Performance Monitor display pane, point to New, and click Data Collector Set. The Create New Data Collector Set Wizard starts. The Data Collector Set created will contain all of the data collectors selected in the current Performance Monitor view.

  • Type in a name for your Data Collection Set and Choose from Template

  • Choose a Template (System Performance for this example)

  • Choose where the Data is going to be saved

  • Choose who to run this as. If you have permissions then this can be left as default. Choose to open the properties for this job

  • The General Tab

  • Click Directory

  • Click Security

  • Click Schedule

  • Stop Condition

  • Click Task

Reports

When this job has finished, Performance Monitor will reconcile a report to show the full history of this job.

Analysing the Results

Data Analysis
A tool that Microsoft support relies on to analyze Performance Monitor logs is the Performance Analysis of Logs (PAL) Tool. Clint Huffman, a Microsoft senior premier field engineer, wrote the 6,000-line VBScript tool, which is free and open source. PAL lets administrators easily analyze Performance Monitor logs without requiring them to be experts in performance counters or Windows architecture.

PAL contains a wizard-based UI that asks specific information about the system, which PAL passes as arguments to the VBScript program. PAL picks up where other log analyzers leave off, such as taking into account whether the system is 64-bit or 32-bit, whether the /3GB switch is used, and how much physical memory is installed—all variables that affect system performance. PAL uses these variables along with known thresholds, which were determined by engineers with years of experience, to determine the analysis that’s displayed. PAL provides a chronological order of alerts, so that you can correlate your system’s performance to any problems that you noticed at specific times.

Counters and Limits

http://technet.microsoft.com/en-us/library/cc768048.aspx

VMware Performance and resolving Issues

CPU

A short spike in CPU usage indicates that you are making the best use of the host resources. However, if the value is constantly high, the host is probably lacking the CPU required to meet the demand. A high CPU usage value can lead to increased ready time and processor queuing of the virtual machines on the host.

If the CPU usage value for a virtual machine is above 90% and the CPU ready value is above 20%, performance is being impacted.

If performance is impacted, consider taking the actions listed below

Actions

  1. Verify that VMware Tools is installed on every virtual machine on the host.
  2. Set the CPU reservations for all high-priority virtual machines to guarantee that they receive the CPU cycles required.
  3. Reduce the number of virtual CPUs on a virtual machine to only the number required to execute the workload. For example, a single-threaded application on a four-way virtual machine only benefits from a single vCPU. But the hypervisor’s maintenance of the three idle vCPUs takes CPU cycles that could be used for other work.
  4. If the host is not already in a DRS cluster, add it to one. If the host is in a DRS cluster, increase the number of hosts and migrate one or more virtual machines onto the new host.
  5. Upgrade the physical CPUs or cores on the host if necessary
  6. Use the newest version of ESX/ESXi, and enable CPU-saving features such as TCP Segmentation Offload, large memory pages, and jumbo frames.

Memory

To ensure best performance, the host memory must be large enough to accommodate the active memory of the virtual machines. Note that the active memory can be smaller than the virtual machine memory size. This allows you to over-provision memory, but still ensures that the virtual machine active memory is smaller than the host memory.
Transient high-usage values usually do not cause performance degradation. For example, memory usage can be high when several virtual machines are started at the same time or when there is a spike in virtual machine workload. However, a consistently high memory usage value (94% or greater) indicates that the host is probably lacking the memory required to meet the demand. If the active memory size is the same as the granted memory size, demand for memory is greater than the memory resources available. If the active memory is consistently low, the memory size might be too large.
If the memory usage value is high, and the host has high ballooning or swapping, check the amount of free physical memory on the host. A free memory value of 6% or less indicates that the host cannot handle the demand for memory. This leads to memory reclamation which may degrade performance.
If the host has enough free memory, check the resource shares, reservation, and limit settings of the virtual machines and resource pools on the host. Verify that the host settings are adequate and not lower than those set for the virtual machines.
If the host has little free memory available, or if you notice a degredation in performance, consider taking the actions listed

  1. Verify that VMware Tools is installed on each virtual machine. The balloon driver is installed with VMware Tools and is critical to performance.
  2. Verify that the balloon driver is enabled. The VMkernel regularly reclaims unused virtual machine memory by ballooning and swapping. Generally, this does not impact virtual machine performance.
  3. Reduce the memory space on the virtual machine, and correct the cache size if it is too large. This frees up memory for other virtual machines.
  4.  If the memory reservation of the virtual machine is set to a value much higher than its active memory, decrease the reservation setting so that the VMkernel can reclaim the idle memory for other virtual machines on the host.
  5. Migrate one or more virtual machines to a host in a DRS cluster.
  6. Add physical memory to the host.

Disk

Use the disk charts to monitor average disk loads and to determine trends in disk usage. For example, you might notice a performance degradation with applications that frequently read from and write to the hard disk. If you see a spike in the number of disk read/write requests, check if any such applications were running at that time.
The best ways to determine if your vSphere environment is experiencing disk problems is to monitor the disk latency data counters. You use the Advanced performance charts to view these statistics.

■  The kernelLatency data counter measures the average amount of time, in milliseconds, that the VMkernel spends processing each SCSI command. For best performance, the value should be 0-1 milliseconds. If the value is greater than 4ms, the virtual machines on the ESX/ESXi host are trying to send more throughput to the storage system than the configuration supports. Check the CPU usage, and increase the queue depth.

■  The deviceLatency data counter measures the average amount of time, in milliseconds, to complete a SCSI command from the physical device. Depending on your hardware, a number greater than 15ms indicates there are probably problems with the storage array. Move the active VMDK to a volume with more spindles or add disks to the LUN.

■  The queueLatency data counter measures the average amount of time taken per SCSI command in the VMkernel queue. This value must always be zero. If not, the workload is too high and the array cannot process the data fast enough.


Actions

  1. Increase the virtual machine memory. This should allow for more operating system caching, which can reduce I/O activity. Note that this may require you to also increase the host memory. Increasing memory might reduce the need to store data because databases can utilize system memory to cache data and avoid disk access.
    To verify that virtual machines have adequate memory, check swap statistics in the guest operating system. Increase the guest memory, but not to an extent that leads to excessive host memory swapping. Install VMware Tools so that memory ballooning can occur.
  2. Defragment the file systems on all guests.
  3. Disable antivirus on-demand scans on the VMDK and VMEM files.
  4. Use the vendor’s array tools to determine the array performance statistics. When too many servers simultaneously access common elements on an array, the disks might have trouble keeping up. Consider array-side improvements to increase throughput.
  5. Use Storage VMotion to migrate I/O-intensive virtual machines across multiple ESX/ESXi hosts
  6. Balance the disk load across all physical resources available. Spread heavily used storage across LUNs that are accessed by different adapters. Use separate queues for each adapter to improve disk efficiency.
  7. Configure the HBAs and RAID controllers for optimal use. Verify that the queue depths and cache settings on the RAID controllers are adequate. If not, increase the number of outstanding disk requests for the virtual machine by adjusting the Disk.SchedNumReqOutstanding parameter. For more information, see the Fibre Channel SAN Configuration Guide.
  8. For resource-intensive virtual machines, separate the virtual machine’s physical disk drive from the drive with the system page file. This alleviates disk spindle contention during periods of high use
  9.  On systems with sizable RAM, disable memory trimming by adding the line MemTrimRate=0 to the virtual machine’s .VMX file.
  10. If the combined disk I/O is higher than a single HBA capacity, use multipathing or multiple links.
  11. For ESXi hosts, create virtual disks as preallocated. When you create a virtual disk for a guest operating system, select Allocate all disk space now. The performance degradation associated with reassigning additional disk space does not occur, and the disk is less likely to become fragmented.
  12. Use the most current ESX/ESXi host hardware.

Networking

Network performance is dependent on application workload and network configuration. Dropped network packets indicate a bottleneck in the network. To determine whether packets are being dropped, use esxtop or the advanced performance charts to examine the droppedTx and droppedRx network counter values.
If packets are being dropped, adjust the virtual machine shares. If packets are not being dropped, check the size of the network packets and the data receive and transfer rates. In general, the larger the network packets, the faster the network speed. When the packet size is large, fewer packets are transferred, which reduces the amount of CPU required to process the data. When network packets are small, more packets are transferred but the network speed is slower because more CPU is required to process the data.

If packets are not being dropped and the data receive rate is slow, the host is probably lacking the CPU resources required to handle the load. Check the number of virtual machines assigned to each physical NIC. If necessary, perform load balancing by moving virtual machines to different vSwitches or by adding more NICs to the host. You can also move virtual machines to another host or increase the host CPU or virtual machine CPU.
If you experience network-related performance problems, also consider taking the actions listed below

Actions

  1. Verify that VMware Tools is installed on each virtual machine.
  2.  If possible, use vmxnet3 NIC drivers, which are available with VMware Tools. They are optimized for high performance.
  3. If virtual machines running on the same ESX/ESXi host communicate with each other, connect them to the same vSwitch to avoid the cost of transferring packets over the physical network.
  4. Assign each physical NIC to a port group and a vSwitch.
  5. Use separate physical NICs to handle the different traffic streams, such as network packets generated by virtual machines, iSCSI protocols, VMotion tasks, and service console activities.
  6.  Ensure that the physical NIC capacity is large enough to handle the network traffic on that vSwitch. If the capacity is not enough, consider using a high-bandwidth physical NIC (10Gbps) or moving some virtual machines to a vSwitch with a lighter load or to a new vSwitch.
  7. If packets are being dropped at the vSwitch port, increase the virtual network driver ring buffers where applicable.
  8. Verify that the reported speed and duplex settings for the physical NIC match the hardware expectations and that the hardware is configured to run at its maximum capability. For example, verify that NICs with 1Gbps are not reset to 100Mbps because they are connected to an older switch.
  9. Verify that all NICs are running in full duplex mode. Hardware connectivity issues might result in a NIC resetting itself to a lower speed or half duplex mode.
  10. Use vNICs that are TSO-capable, and verify that TSO-Jumbo Frames are enabled where possible