What is Iometer?
Iometer is an I/O subsystem measurement and characterization tool for single and clustered systems. It is used as a benchmark and troubleshooting tool and is easily configured to replicate the behaviour of many popular applications. One commonly quoted measurement provided by the tool is IOPS
Iometer can be used for measurement and characterization of:
- Performance of disk and network controllers.
- Bandwidth and latency capabilities of buses.
- Network throughput to attached drives.
- Shared bus performance.
- System-level hard drive performance.
- System-level network performance.
Documentation
http://iometer.cvs.sourceforge.net/*checkout*/iometer/iometer/Docs/Iometer.pdf
http://communities.vmware.com
Downloads
http://www.iometer.org/doc/downloads.html
YouTube
Iometer Tutorial Part 1
Iometer Tutorial Part 2
Iometer Tutorial Part 2b
What are IOPs?
IOPS (Input/Output Operations Per Second, pronounced eye-ops) is a common performance measurement used to benchmark computer storage devices like hard disk drives (HDD), solid state drives (SSD), and storage area networks (SAN). As with any benchmark, IOPS numbers published by storage device manufacturers do not guarantee real-world application performance.
IOPS can be measured with applications, such as Iometer (originally developed by Intel), as well as IOzone and FIO and is primarily used with servers to find the best storage configuration.
The specific number of IOPS possible in any system configuration will vary greatly, depending upon the variables the tester enters into the program, including the balance of read and write operations, the mix of sequential and random access patterns, the number of worker threads and queue depth, as well as the data block sizes.There are other factors which can also affect the IOPS results including the system setup, storage drivers, OS background operations, etc. Also, when testing SSDs in particular, there are preconditioning considerations that must be taken into account
Performance Characteristics
The most common performance characteristics measured are sequential and random operations. Sequential operations access locations on the storage device in a contiguous manner and are generally associated with large data transfer sizes, e.g. 128 KB. Random operations access locations on the storage device in a non-contiguous manner and are generally associated with small data transfer sizes, e.g. 4 KB.

The most common performance characteristics are as follows

Installing and Configuring Iometer


- Click Finish
- You should see everything installed as per below

- Open Iometer AS AN ADMINISTRATOR. (not running as Administrator means you don’t see any drives)
- Accept License
- The Iometer GUI appears, and Iometer starts one copy of Dynamo on the same machine.

- Click on the name of the local computer (Manager)in the Topology panel on the
left side of the Iometer window. The Local Computer (Manager’s) available disk drives appear in the Disk Targets tab. Blue icons represent physical drives; they are only shown if they have no partitions on them. Yellow icons represent logical (mounted) drives; they are only shown if they are writable. A yellow icon with a red slash through it means that the drive needs to be prepared before the test starts
- Disk workers access logical drives by reading and writing a file called iobw.tst in the root directory of the drive. If this file exists, the drive is shown with a plain yellow icon; if the file does not exist, the drive is shown with a red slash through the icon. (If this file exists but is not writable, the drive is considered read-only and is not shown at all.)
- If you select a drive that does not have an iobw.tst file, Iometer will begin the test by creating this file and expanding it until the drive is full

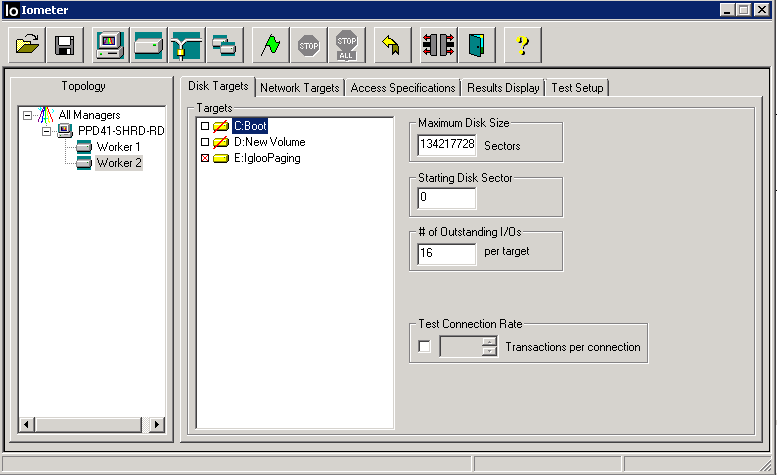
- The Disk Targets tab lets you see and control the disks used by the disk worker(s currently selected in the Topology panel. You can control which disks are used, how much of each disk is used, the maximum number of outstanding I/Os per disk for each worker, and how frequently the disks are opened and closed.
- You can select any number of drives; by default, no drives are selected. Click on a single drive to select it; Shift-click to select a range of drives; Control-click to add a drive to or remove a drive from the current selection

- The Worker underneath your Machine Name – This will default to one worker (thread) for each physical or virtual processor on the system. In the event that Iometer is being used to compare native to virtual performance, make sure that the worker numbers match!
- The Maximum Disk Size control specifies how many disk sectors are used by the
selected worker(s). The default is 0, meaning the entire disk. Then the important part is to fill in the Maximum Disk Size. If you don’t do this, then the first time you run a test, the program will attempt to fill the entire drive with its test file!
- You want to create a file which is much larger than the amount of RAM in your system however sometimes this is not practical if you have servers that are 24GB or 32GB etc
- Please use the following link www.unitconversion.org/data-storage/blocks-to-gigabytes-conversion.html to get a proper conversion of blocks to GBs for a correct figure to put in Maxim Disk size
- E.g. 1GB = 2097152
- E.g. 5GB = 10485760
- E.g. 10GB = 20971520
- The Starting Disk Sector control specifies the lowest-numbered disk sector used by the selected worker(s) during the test. The default is 0, meaning the first 512-byte sector in the disk
- The # of Outstanding I/Os control specifies the maximum number of outstanding asynchronous I/O operations per disk the selected worker(s) will attempt to have active at one time. (The actual queue depth seen by the disks may be less if the operations complete very quickly.) The default value is 1 but if you are using a VM, you can set this to the queue depth value which could be 16 or 32
Note that the value of this control applies to each selected worker and each selected disk. For example, suppose you select a manager with 4 disk workers in the Topology panel, select 8 disks in the Disk Targets tab, and specify a # of Outstanding I/Os of 16. In this case, the disks will be distributed among the workers (2 disks per worker), and each worker will generate a maximum of 16 outstanding I/Os to each of its disks. The system as a whole will have a maximum of 128 outstanding I/Os at a time (4 workers * 2 disks/worker * 16 outstanding I/Os per disk) from this manager
- For all Iometer tests, under “Disk Targets” always increase the “# of Outstanding I/Os” per target. When left at the default value of ‘1′, a relative low load will be placed on the array. By increasing this number some the OS will queue up multiple requests and really saturate the storage. The ideal number of outstanding IOs can be determined by running the test multiple times and increasing this number all the while. At some point IOPS will stop increasing. Generally an increase in return diminishes around 16 IOs/target but certainly more than 32 IOs/target will have no value due to the default queue depth in ESX
Note: If the total number of outstanding I/Os in the system is very large, Iometer or Windows may hang, thrash, or crash. The exact value of “very large” depends on the disk driver and the amount of physical memory available. This problem is due to limitations in Windows and some disk drivers, and is not a problem with the Iometer software. The problem is seen in Iometer and not in other applications because Iometer makes it easy to specify a number of outstanding I/Os that is much larger than typical applications produce.
- The Test Connection Rate control specifies how often the worker(s) open and close their disk(s). The default is off, meaning that all the disks are opened at the beginning of the test and are not closed until the end of the test. If you turn this control on, you can specify a number of transactions to perform between opening and closing. (A transaction is an I/O request and the corresponding reply, if any

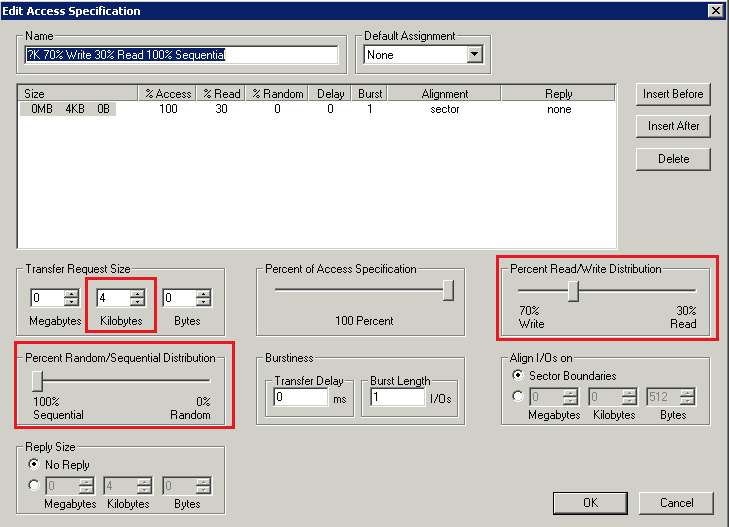
- Click on Access Specifications
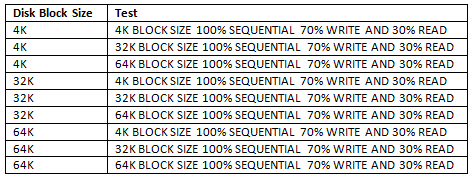
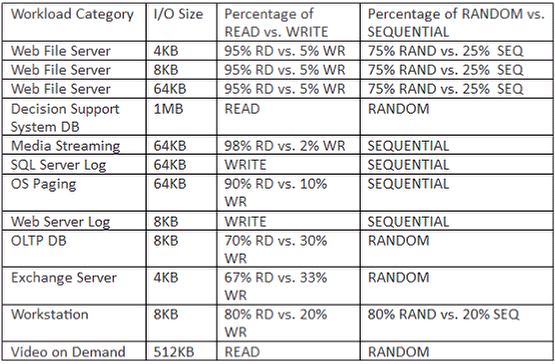
- Check the table below for recommendations
- Click on Access Specifications.

- There is an Access Specification called “All in One” spec that’s included with IOmeter. This spec includes all block sizes at varying levels of randomness and can provide a good baseline for server comparison
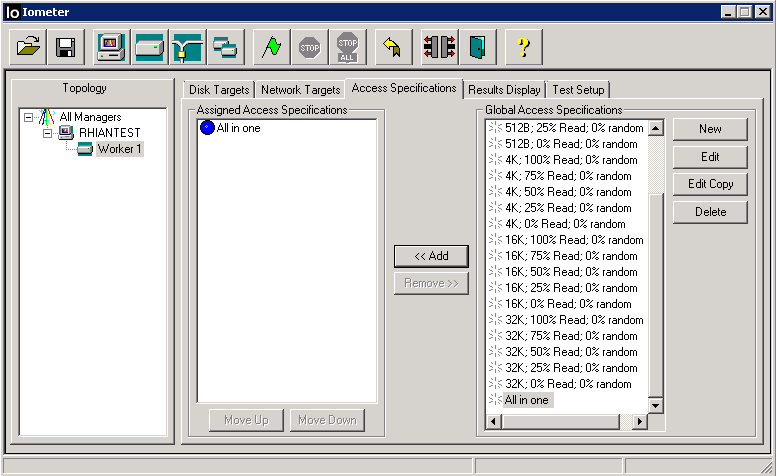
- You can assign a series of targeted tests that get executed in sequential order under the “Assigned Access Specifications” panel. You can use existing IO scenarios or define your own custom access scenario. I am going to assign the “4K; 100% Read; 0% Random” specification by selecting it and clicking the “Add” button. This scenario is self-explanatory, and is generally useful for generating a tremendous amount of IO since your read pattern is optimal and the blocks are small.
- The default is 2-Kilobyte random I/Os with a mix of 67% reads and 33% writes,
which represents a typical database workload
- For maximum throughput (Megabytes per second), try changing the Transfer
Request Size to 64K, the Percent Read/Write Distribution to 100% Read, and
the Percent Random/Sequential Distribution to 100% Sequential.
- For the maximum I/O rate (I/O operations per second), try changing the
Transfer Request Size to 512 bytes, the Percent Read/Write Distribution to
100% Read, and the Percent Random/Sequential Distribution to 100%
Sequential.
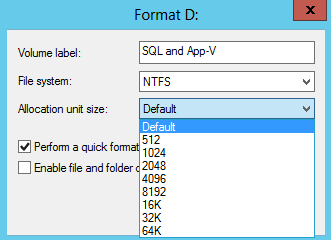
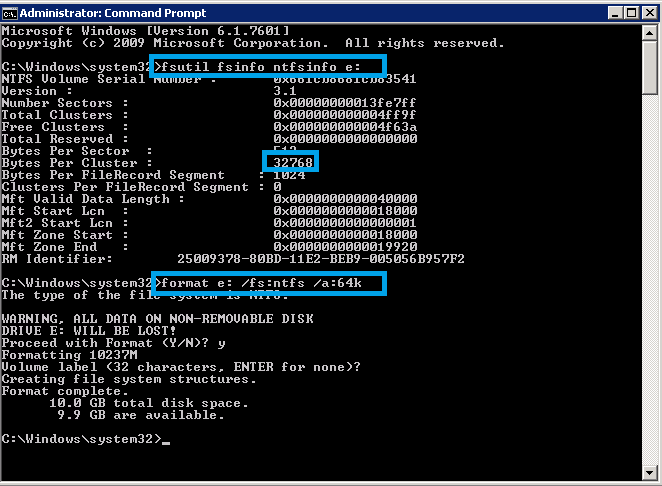
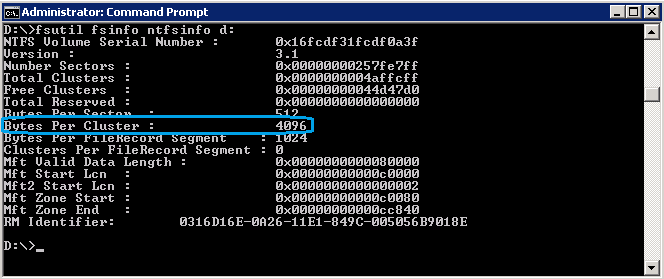
- If you want to check what block size your O/S is using, try typing the below into a command prompt and look at the value for byes per cluster
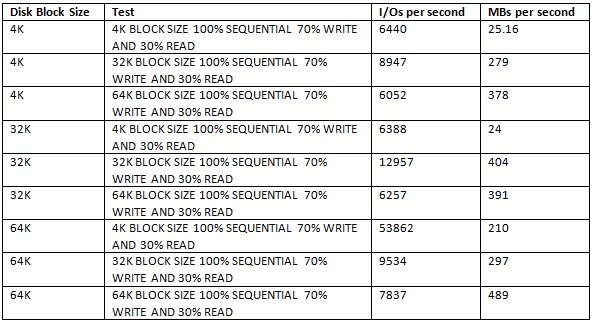
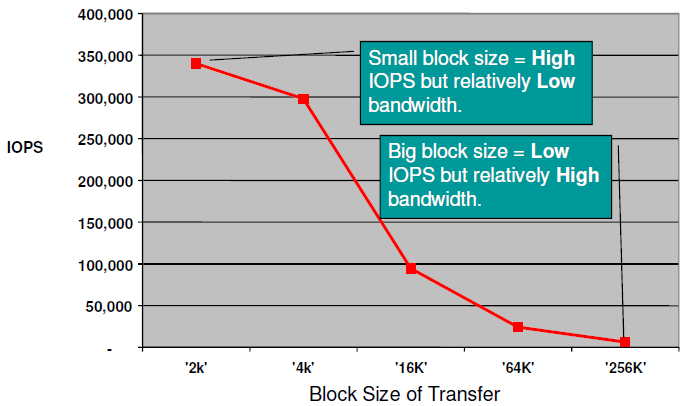
- Note the below relation between block size and bandwidth
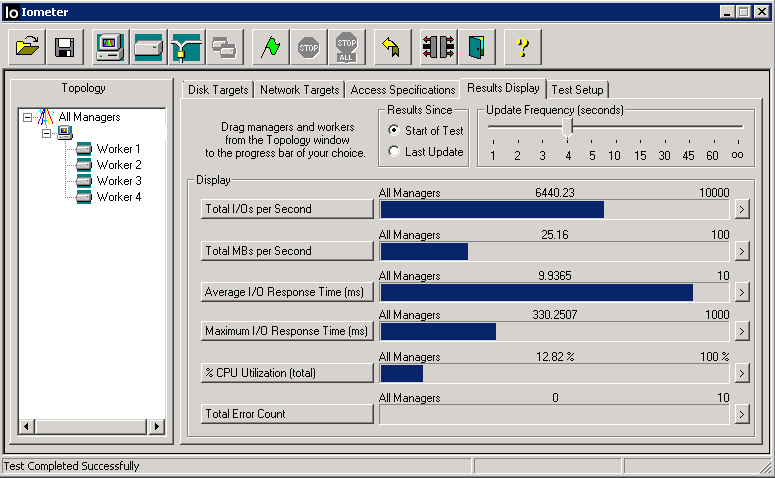
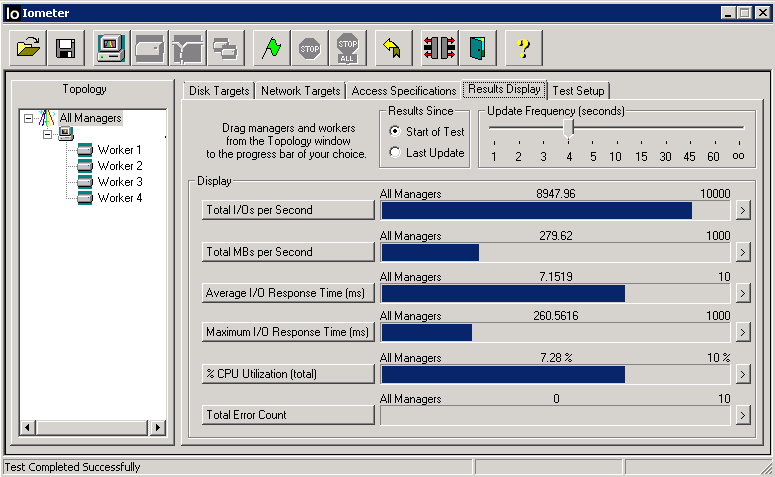
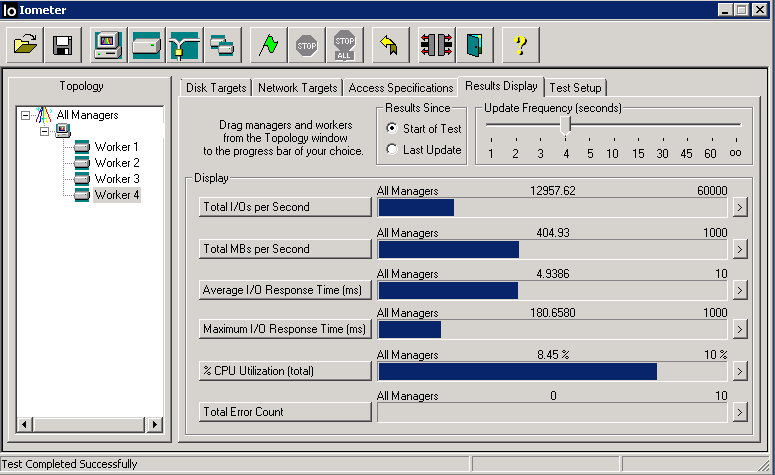
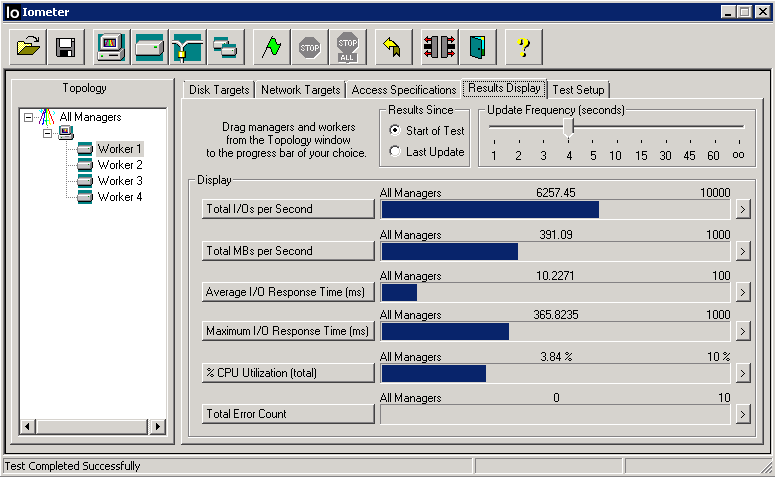
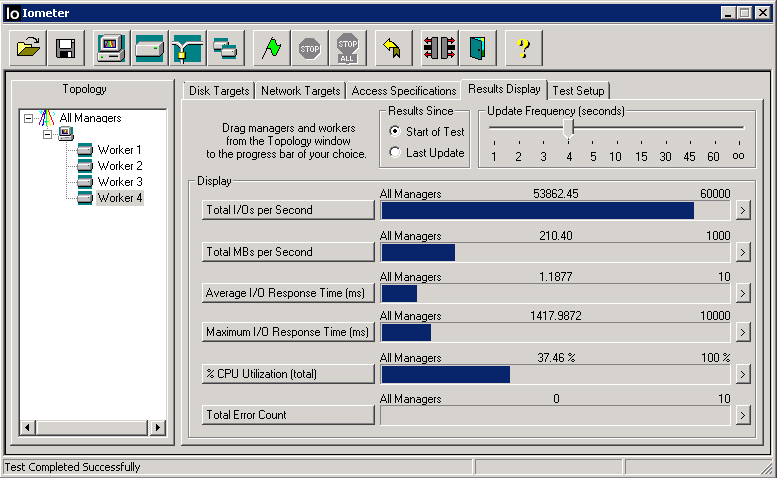
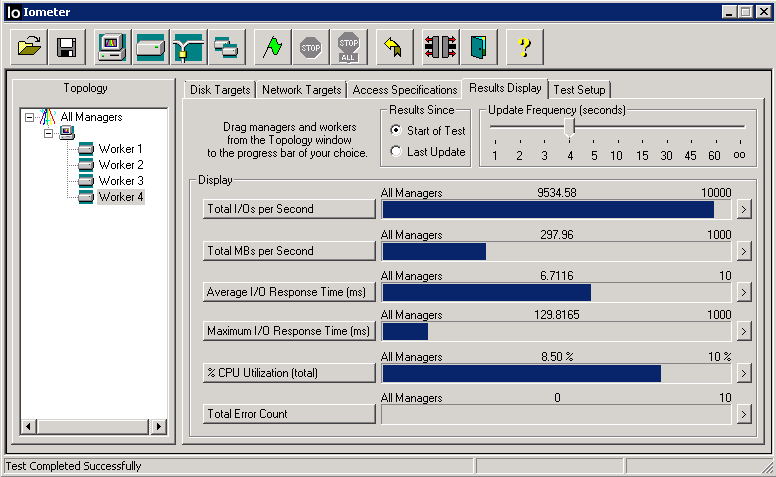
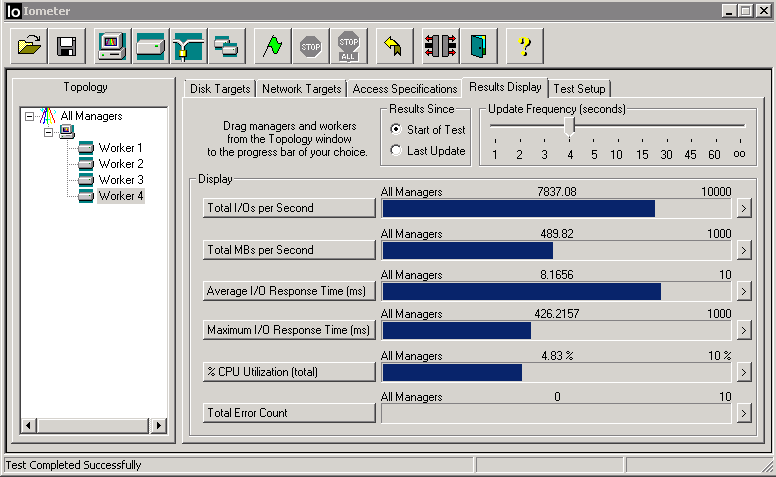
- Next Click on Results Display

- This tab will display your test results real-time once the test has finished. Leave the radio button for “Results Since” set to “Start of Test” as it averages the results as they roll in.
- Obtaining run-time statistics affects the performance of the system. When running a significant test series, the Update Frequency slider should be set to “oo” (infinity). Also, you should be careful not to move the mouse or to have any background processes (such as a screensaver or FindFast) running while testing, to avoid unnecessary CPU utilization and interrupts.
- Set the “Update Frequency” to 2 or 3 seconds. Don’t set it too low as it is possible to affect the test negatively if it is borrowing CPU cycles to keep Iometer updated. While running you will see activity in the “Display” panel at the frequency you set.
- The three most important indicators are “Total I/Os per Second”, “Total MBs per Second”, and “Average I/O Response Time (ms)”.
- Total I/Os indicate the current number of operations occurring against your storage target.
- MBs per Second is a function of <I/Os> * <block size>. This indicates the amount of data your storage target is reading per second.
- One thing is for certain, that you don’t want to see any errors. You have another serious issue if that is what you are seeing
- Go to Test Setup

- The “Test Description” is used as an identifier in the output report if you select that option.
- “Run Time” is something you can adjust. There are no strict rules regulating this setting. The longer you run your test the more accurate your results. You system may have unexpected errors or influences so extending your test a bit will flatten out any anomalies. If it is a production test run it for 20 – 60 minutes. There’s all sorts of ram caching whatever going on, so it reports falsely high for a while. If you watch it run, you’ll see it start off reporting very large numbers, and they slowly get smaller, and smaller, and smaller. Don’t pay any attention to the numbers until they stabilize, might be 30+ minutes.
- “Ramp Up Time” is a useful setting as it allows the disks to spin up and level out the internal cache for a more consistent test result. Set this between 10 seconds and 1 minute.
- “Record Results” is used when you would like to produce a test report following the test. Set it to “None” if you only wish to view the real-time results. You can accept the defaults for “Number of Workers to Spawn Automatically”.
- “Cycling Options” gives one the choice to increment Workers, Targets, and Outstanding I/Os while testing. This is useful in situations where you are uncertain how multiple CPU threads, multiple storage targets, and queue depth effect outcome. Do experiment with these parameters, especially the Outstanding I/Os (Queue Depth). Sometimes this is OS dependent and other times it is hardware related. Remember you can set the “Outstanding I/Os” under the “Disk Targets” tab. In this test we are going to take the default. the choice to increment Workers, Targets, and Outstanding I/Os while testing. This is useful in situations where you are uncertain how multiple CPU threads, multiple storage targets, and queue depth effect outcome.
- Next, now that everything is set, click the Green Flag button at the top to start the test. Following the Ramp Up time (indicated in the status bar) you will begin to see disk activity

- It will prompt you to select a location to save your .csv
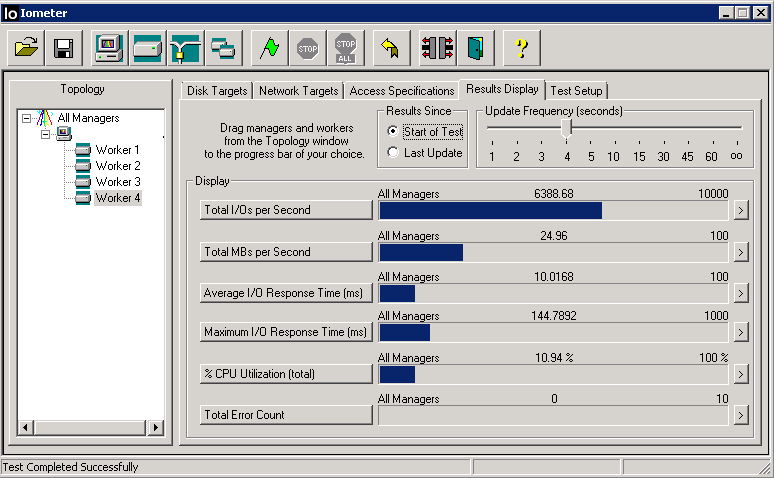
- While the tests are running, you will see the below

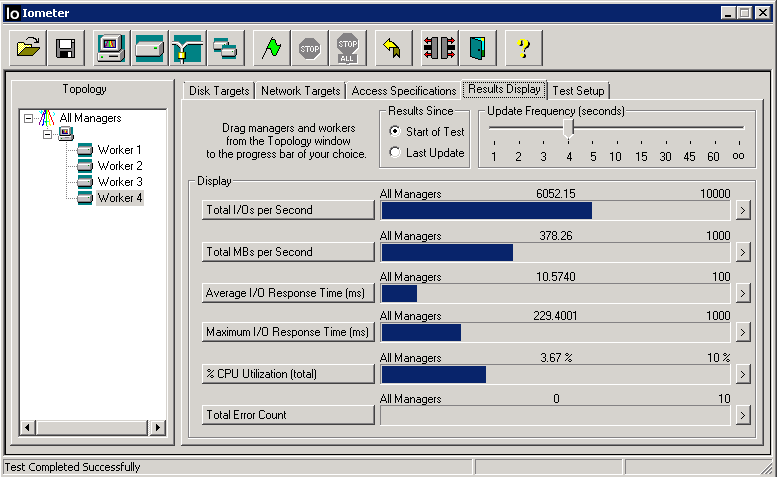
- You can expand a particular result into its own screen by pressing the right-arrow at the right of each test, which results in a screen similar to the one shown below

To test network performance between two computers (A and B)
- On computer A, double-click on Iometer.exe. The Iometer main window appears and a Dynamo workload generator is automatically launched on computer A.
- On computer B, open an MS-DOS Command Prompt window and execute Dynamo, specifying computer A’s name as a command line argument.
- For example: C:\> dynamo computer_a
- On computer A again, note that computer B has appeared as a new manager in the Topology panel. Click on it and note that its disk drives appear in the Disk Targets tab.
- With computer B selected in the Topology panel, press the Start Network Worker button (picture of network cables). This creates a network server on computer B.
- With computer B still selected in the Topology panel, switch to the Network Targets tab, which shows the two computers and their network interfaces. Select one of computer A’s network interfaces from the list. This creates a network client on computer A and connects the client and server together.
- Switch to the Access Specifications tab. Double-click on “Default” in the Global Access Specifications list. In the Edit Access Specification dialog, specify a Transfer Request Size of 512 bytes. Press OK to close the dialog.
- Switch to the Results Display tab. Set the Update Frequency to 10 seconds.
- Press the Start Tests button. Select a file to store the test results. If you specify an existing file, the new results will be appended to the existing ones.
- Watch the results in the Results Display tab.
- Press the Stop Test button to stop the test and save the results.
Useful Powerpoint Presentation
Texas Systems Storage Presentation
Brilliant Iometer Results Analysis
http://blog.open-e.com/random-vs-sequential-explained/