Archive for April 2013

Configure VMware vMA as an ESXi 4 Syslog Server

magglass

Configure VMware vMA as an ESXi 4 Syslog Server

A lot of people don’t know you can set up vMA as a Syslog Server in vSphere ESXi 4. vSphere 5 has the built-in SysLog Installation but what do you do if you’re running vSphere 4?

Pre Requisites

  • VMware vMA

Instructions

Step 1 – Deploy a vMA Server

  • Deploy a vMA Server in vCenter. Follow this link for full instructions
  • Specify the Hostname, IP address, Subnet Mask, Default gateway and DNS information
  • Specify a Password for the vi-admin account

Step 2 – Configure Time

ESXi uses UTC for internal time stamping. In order to avoid timestamp issues the vMA should be set to UTC for time keeping. When vMA collects the logs from your ESXi Host, sometimes the logs have the ESXi Host timestamp and sometimes they will have the vMA Localtime timestamp

  • Remove the Local Time
  • sudo rm /etc/localtime
  • Create a symbolic link to the UTC timezone
  • sudo ln –s /usr/share/zoneinfo/UTC /etc/localtime
  • Edit the NTP configuration file. Find the section # Use public servers from the pool.ntp.org project and replace the current entries with your preferred NTP servers
  • sudo nano /etc/ntp.conf
  • Configure the NTP daemon to start on reboot
  • sudo /sbin/chkconfig ntpd on
  • Restart the NTP daemon:
  • sudo /sbin/service ntpd restart
  • Confirm the NTP server connections are up
  • sudo ntpq -np
  • Change the keyboard to English if required in the location below. Change KEYTABLES=”us” to use the keyboard you have, for example: KEYTABLES=”en”
  • sudo vi /etc/sysconfig/keyboard

Step 3 – Add additional Storage to the vMA

  • Shutdown the vMA VM
  • Attach an additional disk to the VM. Choose how big you want it. A very rough estimate of the amount of log information captured would be 500MB per host, per day.
  • Power on vMA
  • Login in using vi-admin
  • Format the new Disk with the following command
  • fdisk /dev/sdb
  • Use the n command to create a new partition
  • Use the p command to make the new partition a primary partition
  • Press 1 to make it partition #1
  • Use the default for the First Cylinder
  • Use the default for the Last Cylinder
  • Use the p command to verify the partition table
  • Use the w command to write the partition table to the hard disk
  • Press Enter a couple of times to confirm it’s finished and return to the command prompt
  • Now we need to format the partition using the follow command
  • sudo mkfs -t ext3 /dev/sdb1

Step 4 – Mount the Disk

  • Edit /etc/fstab using the following command
  • nano /etc/fstab
  • Enter in the following line. Use tab to line up the entries
  • /dev/sdb1  /var/log/syslog  ext3  defaults,auto  1 2
  • Use Ctrl+X then Y to save the file
  • Next: cd /var/log/ then mkdir syslog
  • Change the owner of the /syslog dir
  • sudo chown vi-admin:root /var/log/syslog
  • finally mount the disk
  • mount /var/log/syslog

Step 5 – Edit the vilogger application file so it knows where to store the logfiles. The default location is /var.log/vmware which needs changing

  •  Edit the vilogger config file
  • sudo nano /etc/vmware/vMA/vMA.conf
  • Change the location entries (three of them) to <location>/var/log/syslog</location>
  • Use Ctrl+X then Y to save the file
  • Start (or restart) the vilogger daemon
  • sudo service vmware-vilogd start
  • Now vilogger is set to store the logs on to your new disk

Step 6 – Configure vMA to collect your logs

  •  Add the first host using fastpass authentication
  • vifp addserver –authpolicy fpauth
  • Add the second host, then the third host and all hosts you need before proceeding to the next step
  • Enter the root password when prompted
  • Verify the server has been added
  • vifp –listservers
  • Enable vilogging
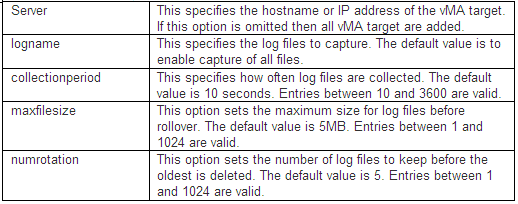
  • vilogger enable –server –numrotation 20 –maxfilesize 10 –collectionperiod 300
  • To access the help type vilogger –help

ESXi logging collects 3 logs (vpxa.log, hostd.log, and messages.log). Rough math is number of logs X number of hosts X maxrotations X maxfilesizes = total MB for logs. You’ll need slightly more than that for vilogger’s logs (depending on where you placed those when you edited vMA.conf).
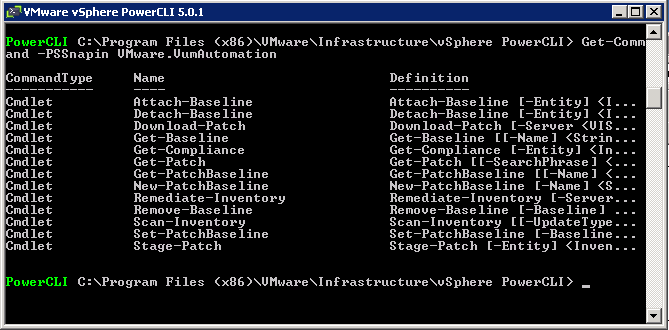
vilogger Options 

vilogger

Other Links

http://kb.vmware.com/selfservice/microsites/search.do?language=en_US&cmd=displayKC&externalId=1016621

http://kb.vmware.com/selfservice/microsites/search.do?language=en_US&cmd=displayKC&externalId=1024122

Memory Overcommitment and Java Applications

java

How can we monitor Java Applications on Virtualised Systems?

We can’t determine all we need to know about a Java workload from system tools such as System Monitor. We need to use specialized Java monitoring tools such as the below tools which helps us see inside the Java Heap, Garbage Collection, and other relevant Java metrics.

  • JConsole
  • vCenter Operations Suite

What is the Java Heap?

The Java Heap is used to store objects that the program is working on. For example, an object could be a customer record, a file or anything else the program has to manipulate. As objects are created, used and discarded by the program, you will see the Heap memory size change. Discarded objects (referred to as dead objects) are not immediately removed from the heap when the program is done with them. Instead, a special task called Garbage Collection, runs through the heap to detect dead objects. Once it detects a dead object, it deletes the object and frees up the memory.

The Java Heap is divided in to pools of memory, referred to as generations. There are three generations called

  • Eden Space
  • Survivor Space
  • Tenured Gen

This helps the Garbage collection (GC) process become more efficient by reducing the amount of memory it has to scan each time a GC is run. GC is run on the ‘Eden Space’ more often as this is where new objects are stored. GC runs less often on the Survivor space and even less often on the Tenured Gen space. If an object survives one GC run in the Eden Space, it is moved to the Survivor Space. If an object exists in the Survivor Space for some time, it is moved to the Tenured Gen.

Memory Reclamation Techniques

When running Java workloads on in an x86 Virtual Machine (i.e. a VM in the VMware sense of the word), it is recommended that you do not overcommit memory because the JVM memory is an active space where objects are constantly being created and garbage collected. Such an active memory space requires its memory to be available all the time. If you overcommit memory, memory reclamation techniques such as compression, ballooning or swapping may occur and impede performance

  • Memory compression involves compressing pages of memory (zipping) and storing them compressed instead of in native format. It has a performance impact because resources are used to compress and uncompress memory as it is being accessed. The host attempts to only compress inactive memory pages if at all possible. As GC runs through the java heap, it accesses lots of memory that may behave been marked as inactive. This causes any memory that has been compressed to decompress using up further VM resources.
  • Ballooning employs the memory balloon driver (vmmemctl), which is part of the VMware Tools package. This is loaded into the guest operating system on boot. When memory resources on the host become scarce (contended), the host tells the balloon driver to request memory (inflate) up to a target size (balloon target). The target is based on the amount of inactive memory the host believes the guest is holding on to. The memory balloon driver starts to request memory from the guest OS to force the guest to clean up inactive memory. Once the balloon driver has been allocated memory by the guest OS, it releases this back to other VMs by telling the Hypervisor that the memory is available. Once again, what appears to be inactive memory to the host may soon be subject to garbage collection, and become active again. If the guest has no inactive memory to release, it starts paging memory to disk in response to the request for memory from the balloon driver. This has a very negative impact on java performance
  • Swapping. This is a last resort memory reclamation technique that no application wants to be faced with. A serious decline in performance is likely with swapping

Best Practices

  • Enterprise Java Applications on VMware Best Practice Guide, which says you should not exceed 80% CPU utilization on the ESX host.
  • Reserving memory at the VM level is in general not a good idea, but essential for Java workloads due to the highly active java memory heap space. However, creating a memory reservation is a manual intervention step that we should try to avoid. Consider the situation in a large, dynamic, automated self-service environment (i.e. Cloud). Also, if we’re reserving memory for peak workloads within our java applications, we’re wasting resources as our applications don’t run at peak workload all the time. It would be good if the Java VM would just talk to the vSphere VM to let it know what memory is active, and what memory is idle so that vSphere could manage memory better, and the administrator could consolidate Java workloads without the fear of memory contention, or reserving memory for peak times.
  • Introducing VMware vFabric Elastic Memory for Java (EM4J). With EM4J, the traditional memory balloon driver is replaced with the EM4J balloon driver. The EM4J memory balloon sits directly in the Java heap and works with new memory reclamation capabilities introduced in ESXi 5.0. EM4J works with the hypervisor to communicate system-wide memory pressure directly into the Java heap, forcing Java to clean up proactively and return memory at the most appropriate times—when it is least active. You no longer have to be so conservative with your heap sizing because unused heap memory is no longer wasted on uncollected garbage objects. And you no longer have to give Java 100% of the memory that it needs; EM4J ensures that memory is used more efficiently, without risking sudden and unpredictable performance problems.

vFabric Elastic Memory for Java (EM4J)

vFabric Elastic Memory for Java (EM4J) is a set of technologies that helps optimize memory utilization for ESXi virtual machines running Java workloads.

EM4J provides vSphere administrators with the following tools:

  • The EM4J plug-in for the vSphere Web Client, together with the EM4J Console Guest Collector, provides a detailed, historical view of virtual machine and JVM memory usage, which helps vSphere administrators size the VM and Java heap memory optimally.
  • The EM4J agent establishes a memory balloon in the Java heap, which helps maintain predictable Java application performance when host memory becomes scarce. The balloon works with the ESXi hypervisor to reclaim memory from the Java heap when other VMs need memory.
  • The EM4J plug-in and the EM4J agent can be used together or independently.

For more information about EM4J, see vFabric Elastic Memory for Java Documentation at the link below

http://www.vmware.com/support/pubs/vfabric-em4j.html


Using VMware PowerCLI to manage VMware vSphere Update Manager Tasks

index

Requirements

  • PowerCLI 4.1 or higher
  • Update Manager PowerCLI Plugin
  • .NET 2.0 SP1
  • Windows PowerShell 2.0/3.0

Procedure

Install Update Manager PowerCLI

  1. Download the Update Manager PowerCLI plugin (You will need to login)
  2. https://my.vmware.com/group/vmware/get-download?downloadGroup=VUM51PCLI
  3. Navigate to the directory containing the Update Manager PowerCLI installation files.
  4. Run VMware-UpdateManager-Pscli-5.0.0-432001. Note that the version may be different for your installation.
  5. If prompted with a User Access Control warning, click Yes.
  6. On the Welcome screen, click Next.
  7. Accept the License Agreement, click Next.
  8. Click Install.
  9. Click Finish once the installation completes.
  10. Open the vSphere PowerCLI console from the Windows Start menu or by clicking the vSphere PowerCLI shortcut icon.
  11. Type Connect-VIServer
  12. Ignore the yellow certificate warnings or you can type the command to ignore them
  13. Type Get-Command -PSSnapin VMware.VumAutomation to get all the commands associated with this pssnapin

powercli

To create Patch Baselines

updatemanager

Attaching and Detaching Baselines

2

Scanning a Virtual Machine

3

To verify whether a virtual machine has at least one baseline with Unknown compliance status attached to it and start a scan

4

Staging Patches

Staging can be performed only for hosts, clusters, and datacenters.

5

Remediating Inventory Objects

You can remediate virtual machines, virtual appliances, clusters, and hosts.

6

Downloading Patches and Scanning Objects

7

VMware Link

http://pubs.vmware.com/vsphere-50/topic/com.vmware.ICbase/PDF/vsphere-update-manager-powercli-50-inst-admg.pdf

Quest ActiveRoles Management Shell for Active Directory

untitled

Quest ActiveRoles Management Shell for Active Directory

The ActiveRoles Management Shell for Active Directory is a set of predefined commands for Windows PowerShell, the new command line and scripting language developed by Microsoft. These commands are designed to help administrators automate common, repetitive and bulk management tasks such as creating, removing or updating objects in Active Directory.
By using the ActiveRoles Management Shell for Active Directory to build your scripts, you can harness Quest ActiveRoles Server to leverage proven rules, roles, workflow and attestation features giving you a robust management option for Windows PowerShell and Active Directory.

The management operations are performed either via the Quest ActiveRoles Server proxy service or by directly accessing directory data on domain controllers. In both cases, the ActiveRoles Management Shell provides a flexible scripting platform that can reduce the complexity of current Microsoft Visual Basic scripts. Tasks that previously required many lines in Visual Basic scripts can now be done by using as little as one line of code in the ActiveRoles Management Shell.

Installing the ActiveRoles Management Shell

q1

q2

q3

q4

q5

Opening the ActiveRoles Management Shell

You can open the ActiveRoles Management Shell by using either of the
following procedures. Each procedure loads the ActiveRoles Management Shell
snap-in into Windows PowerShell. If you do not load the ActiveRoles
Management Shell snap-in before you run a command (cmdlet) provided by
that snap-in, you will receive an error.

To open the ActiveRoles Management Shell from the Programs menu

  • Select Start | All Programs | Quest Software | ActiveRoles Management Shell for Active Directory.

To add the ActiveRoles Management Shell snap-in from Windows
PowerShell

  • Select Start | All Programs | Windows PowerShell 1.0 | Windows PowerShell.
  • At the Windows PowerShell prompt, enter the following command:
  • Add-PSSnapin Quest.ActiveRoles.ADManagement

Using the ActiveRoles Management Shell

  • Select Start | All Programs | Quest Software | ActiveRoles Management Shell for Active Directory.

q0

Admin Guide

Quest ActiveRoles Management Shell Admin Guide

Example Command to check for inactive users in Active Directory

get-qaduser -SizeLimit 0 | Where-Object{$_.LastLogon -lt $limit -OR $lastLogon -ne $null} | Sort-Object LastLogon | Select-Object Name, SAMAccountName, LastLogon | Export-CSV C:\PATH\TO\file.csv