We had an interesting problem with a 6 host vSAN cluster where 1 host seemed to be in a network partition according to Skyline Health. I thought it would be useful to document our troubleshooting steps as it can come in useful. Our problem wasn’t one of the usual network mis-configurations but in order to reach that conclusion we needed to perform some usual tests
We had removed this host from the vSAN cluster, the HA cluster and removed from the inventory and rebuilt it, then tried adding it back into the vSAN cluster with the other 5 hosts. It let us add the host to the current vSAN Sub-cluster UUID but then partitioned itself from the other 5 hosts.
Usual restart of hostd, vpxa, clomd and vsanmgmtd did not help.
Test 1 – Check each host’s vSAN details
Running the command below will tell you a lot of information on the problem host, in our case techlabesxi1
Straightaway we can see it is partitioned as the Sub-Cluster Member UUIDs should have the other 5 hosts’ UUID in and the Sub-Cluster Member Hostnames should have techlabesxi2, techlabesxi3, techlabesxi4, techlabesxi5, techlabesxi6. It has also made itself a MASTER where as we already have a master with the other partitioned vSAN cluster and there can’t be two masters in a cluster.
Master role:
A cluster should have only one host with the Master role. More than a single host with the Master role indicates a problem
The host with the Master role receives all CMMDS updates from all hosts in the cluster
Backup role:
The host with the Backup role assumes the Master role if the current Master fails
Normally, only one host has the Backup role
Agent role:
Hosts with the Agent role are members of the cluster
Hosts with the Agent role can assume the Backup role or the Master role as circumstances change
In clusters of four or more hosts, more than one host has the Agent role
Test 2 – Can each host ping the other one?
A lot of problems can be caused by the misconfiguration of the vsan vmkernel and/or other vmkernel ports however, this was not our issue. It is worth double checking everything though. IP addresses across the specific vmkernel ports must be in the same subnet.
Get the networking details from each host by using the below command. This will give you the full vmkernel networking details including the IP address, Subnet Mask, Gateway and Broadcast
esxcli network ip interface ipv4 address list
It may be necessary to test VMkernel network connectivity between ESXi hosts in your environment. From the problem host, we tried pinging the other hosts management network.
vmkping -I vmkX x.x.x.x
Where x.x.x.x is the hostname or IP address of the server that you want to ping and vmkX is the vmkernel interface to ping out of.
This was all successful
Test 3 – Check the unicast agent list and check the NodeUUIDs on each host
To get a check on what each host’s nodeUUID is, you can run
esxcli vsan cluster unicastagent list
Conclusion
We think what happened was that the non partitioned hosts had a reference to an old UUID for techlabesx01 due to us rebuilding the host. The host was removed from the vSAN cluster and the HA cluster and completely rebuilt. However, when we removed this host originally, the other hosts did not seem to update themselves once it had gone. So when we tried to add it back in, the other hosts didn’t recognise it.
The Fix
What we had to do was disable ClustermemberListUpdates on each host
This blog is similar to another I wrote which compared VM Encryption and vSAN encryption on ESXi 6.7U3. This time, I’m comparing VM Encryption performance on ESXi 6.7U3 and ESXi 7.0U2 running on vSAN.
What is the problem which needs to be solved?
I have posted this section before on the previous blog however it is important to understand the effect of an extra layer of encryption has on the performance of your systems. It has become a requirement (sometimes mandatory) for companies to enable protection of both personal identifiable information and data; including protecting other communications within and across environments New EU General Data Protection Regulations (GDPR) are now a legal requirement for global companies to protect the personal identifiable information of all European Union residents. In the last year, the United Kingdom has left the EU, however the General Data Protection Regulations will still be important to implement. “The Payment Card Industry Data Security Standards (PCI DSS) requires encrypted card numbers. The Health Insurance Portability and Accountability Act and Health Information Technology for Economic and Clinical Health Acts (HIPAA/HITECH) require encryption of Electronic Protected Health Information (ePHI).” (Townsendsecurity, 2019) Little is known about the effect encryption has on the performance of different data held on virtual infrastructure. VM encryption and vSAN encryption are the two data protection options I will evaluate for a better understanding of the functionality and performance effect on software defined storage.
It may be important to understand encryption functionality in order to match business and legal requirements. Certain regulations may need to be met which only specific encryption solutions can provide. Additionally, encryption adds a layer of functionality which is known to have an effect on system performance. With systems which scale into thousands, it is critical to understand what effect encryption will have on functionality and performance in large environments. It will also help when purchasing hardware which has been designed for specific environments to allow some headroom in the specification for the overhead of encryption
Testing Components
Test lab hardware (8 Servers)
HCIBench Test VMs
80 HCIBench Test VMs will be used for this test. I have placed 10 VMs on each of the 8 Dell R640 servers to provide a balanced configuration. No virtual machines other than the HCIBench test VMs will be run on this system to avoid interference with the testing.
The HCIBench appliance is running vdBench, not Fio
The specification of the 80 HCIBench Test VMs are as follows.
RAID Configuration
VM encryption will be tested on RAID1 and RAID6 vSAN storage
VM encryption RAID1 storage policy
Test Parameters
Configuration
vCenter Storage Policy
Name = raid1_vsan_policy Storage Type = vSAN Failures to tolerate = 2 (RAID 1) Thin provisioned = Yes Number of disk stripes per object = 2 Encryption enabled = Yes Deduplication and Compression enabled = No
VM encryption RAID6 storage policy
Test Parameters
Configuration
vCenter Storage Policy
Name = raid6_vsan_policy Storage Type = vSAN Failures to tolerate = 2 (RAID6) Thin provisioned = Yes Number of disk stripes per object = 1 Encryption enabled = Yes Deduplication and Compression enabled = No
HCIBench Test Parameters
The test will run through various types of read/write workload at the different block sizes to replicate different types of applications using 1 and 2 threads.
0% Read 100% Write
20% Read 80% Write
70% Read 30% Write
The block sizes used are
4k
16k
64k
128k
The test plan below containing 24 tests will be run for VM Encryption on 6.7U3 and again for VM Encryption on 7.0U2. These are all parameter files which are uploaded in HCIBench then can run sequentially without intervention through the test. I think I left these running for 3 days! It refreshes the cache in between tests.
Scroll across at the bottom to see the whole table
Test
Number of disks
Working Set %
Number of threads
Block size (k)
Read %
Write %
Random %
Test time (s)
1
2 (O/S and Data)
100%
1
4k
0
100
100
7200
2
2 (O/S and Data)
100%
2
4k
0
100
100
7200
3
2 (O/S and Data)
100%
1
4k
20
80
100
7200
4
2 (O/S and Data)
100%
2
4k
20
80
100
7200
5
2 (O/S and Data)
100%
1
4k
70
30
100
7200
6
2 (O/S and Data)
100%
2
4k
70
30
100
7200
7
2 (O/S and Data)
100%
1
16k
0
100
100
7200
8
2 (O/S and Data)
100%
2
16k
0
100
100
7200
9
2 (O/S and Data)
100%
1
16k
20
80
100
7200
10
2 (O/S and Data)
100%
2
16k
20
80
100
7200
11
2 (O/S and Data)
100%
1
16k
70
30
100
7200
12
2 (O/S and Data)
100%
2
16k
70
30
100
7200
13
2 (O/S and Data)
100%
1
64k
0
100
100
7200
14
2 (O/S and Data)
100%
2
64k
0
100
100
7200
15
2 (O/S and Data)
100%
1
64k
20
80
100
7200
16
2 (O/S and Data)
100%
2
64k
20
80
100
7200
17
2 (O/S and Data)
100%
1
64k
70
30
100
7200
18
2 (O/S and Data)
100%
2
64k
70
30
100
7200
19
2 (O/S and Data)
100%
1
128k
0
100
100
7200
20
2 (O/S and Data)
100%
2
128k
0
100
100
7200
21
2 (O/S and Data)
100%
1
128k
20
80
100
7200
22
2 (O/S and Data)
100%
2
128k
20
80
100
7200
23
2 (O/S and Data)
100%
1
128k
70
30
100
7200
24
2 (O/S and Data)
100%
2
128k
70
30
100
7200
HCIBench Performance Metrics
These metrics will be measured across all tests
Workload Parameter
Explanation
Value
IOPs
IOPS measures the number of read and write operations per second
Input/Outputs per second
Throughput
Throughput measures the number of bits read or written per second Average IO size x IOPS = Throughput in MB/s
MB/s
Read Latency
Latency is the response time when you send a small I/O to a storage device. If the I/O is a data read, latency is the time it takes for the data to come back
ms
Write Latency
Latency is the response time when you send a small I/O to a storage device. If the I/O is a write, latency is the time for the write acknowledgement to return.
ms
Latency Standard Deviation
Standard deviation is a measure of the amount of variation within a set of values. A low standard deviation indicates that the values tend to be close to the mean of the set, while a high standard deviation indicates that the values are spread out over a wider range
Values must be compared to the standard deviation
Average ESXi CPU usage
Average ESXi Host CPU usage
%
Average vSAN CPU usage
Average CPU use for vSAN traffic only
%
Results
IOPs
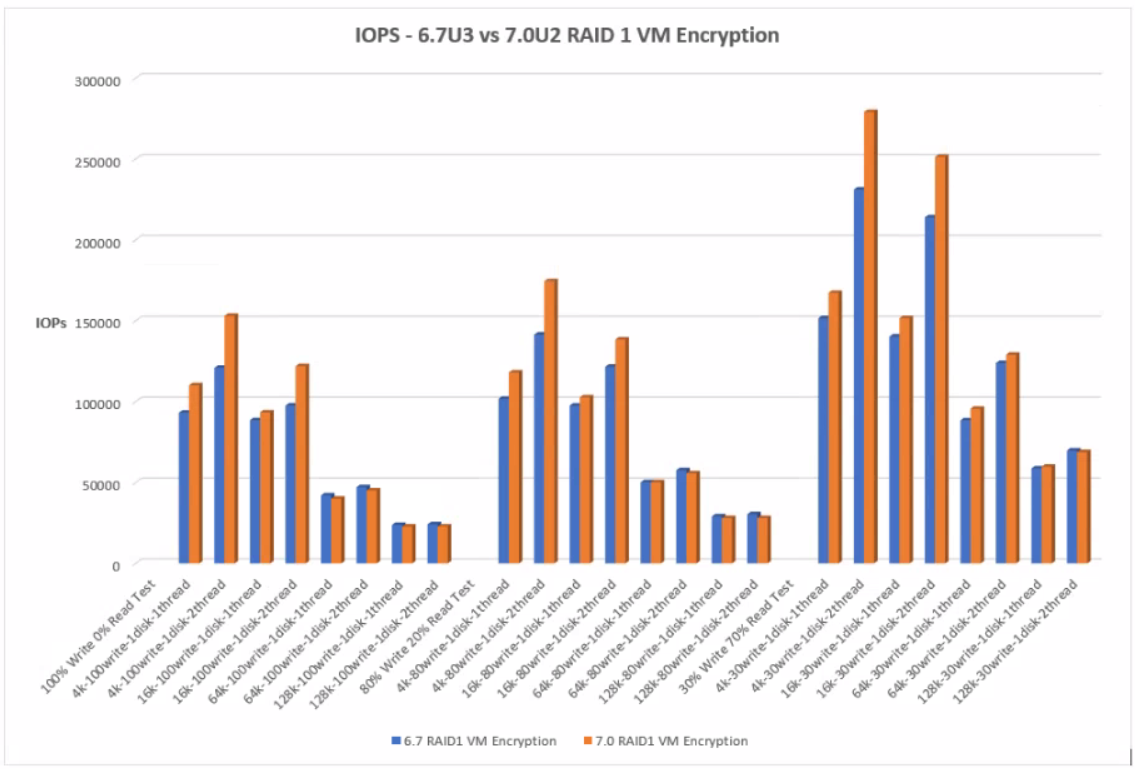
IOPS measures the number of read and write operations per second. The pattern for the 3 different tests is consistent where the heavier write tests show the least IOPs gradually increasing in IOPs as the writes decrease.
IOPS and block size tend to have an inverse relationship. As the block size increases, it takes longer latency to read a single block, and therefore the number of IOPS decreases however, smaller block sizes yield higher IOPS
With RAID1 VM Encryption, 7.0U2 performs better than 6.7U3 at the lower block level – 4k and 16k but as we get into the larger 64k and 128k blocks, there is less of a difference with 6.7U3 having the slight edge over IOps performance.
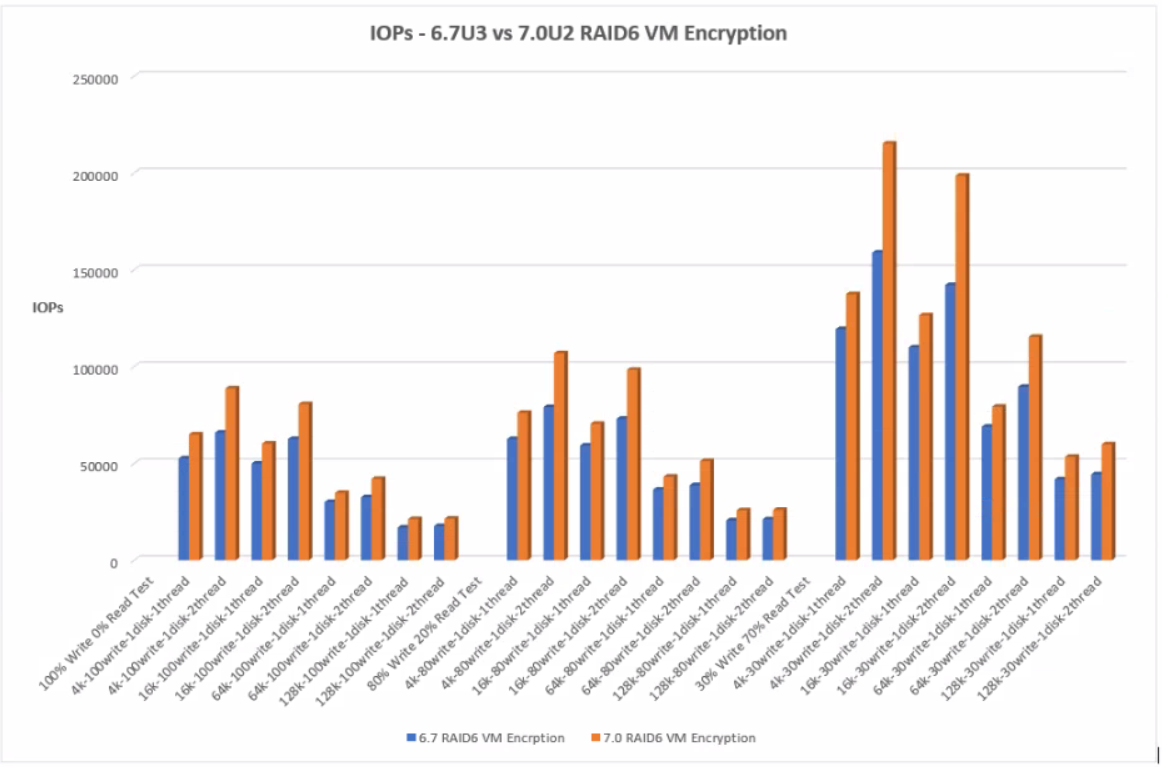
With RAID6 VM Encryption, 7.0U2 has consistently higher IOPS across all tests than 6.7U3.
RAID6 VM Encryption produces less IOPs than RAID1 VM Encryption which is expected due to the increased overhead RAID6 incurs over RAID1 in general. RAID 1 results in 2 writes, one to each mirror. A RAID6 single write operation results in 3 reads and 3 writes (due to double parity) Each write operation requires the disks to read the data, read the first parity, read the second parity, write the data, write the first parity and then finally write the second parity.
RAID 1 VM Encryption
The graph below shows the comparison of IOPs between 6.7U3 and 7.0U2 with RAID 1 VM Encryption
Click the graph for an enlarged view
RAID 6 VM Encryption
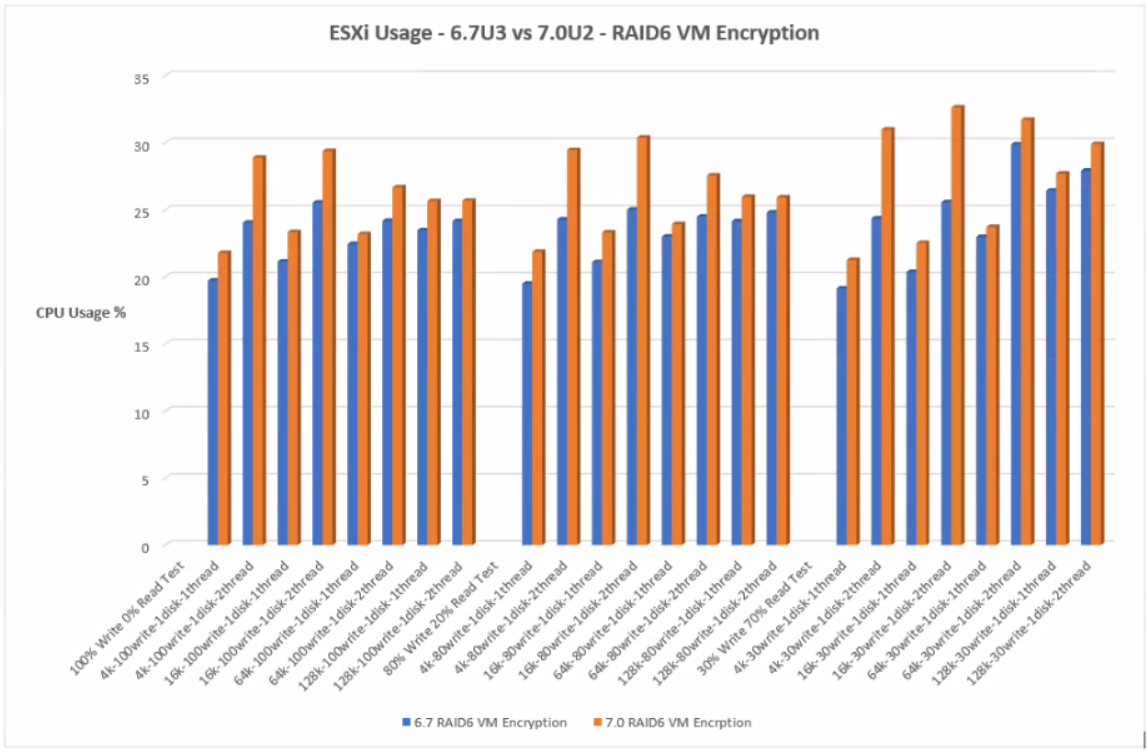
The graph below shows the comparison of IOPs between 6.7U3 and 7.0U2 with RAID6 VM Encryption
Click the graph for an enlarged view
Throughput
IOPs and throughput are closely related by the following equation.
Throughput (MB/s) = IOPS * Block size
IOPS measures the number of read and write operations per second, while throughput measures the number of bits read or written per second. The higher the throughput, the more data which can be transferred. The graphs follow a consistent pattern from the heavier to the lighter workload tests. I can see the larger block sizes such as 64K and 128K have the greater throughput in each of the workload tests than 4K or 8K. As the block sizes get larger in a workload, the number of IOPS will decrease. Even though it’s fewer IOPS, you’re getting more data throughput because the block sizes are bigger. The vSAN datastore is a native 4K system. It’s important to remember that storage systems may be optimized for different block sizes. It is often the operating system and applications which set the block sizes which then run on the underlying storage. It is important to test different block sizes on storage systems to see the effect these have.
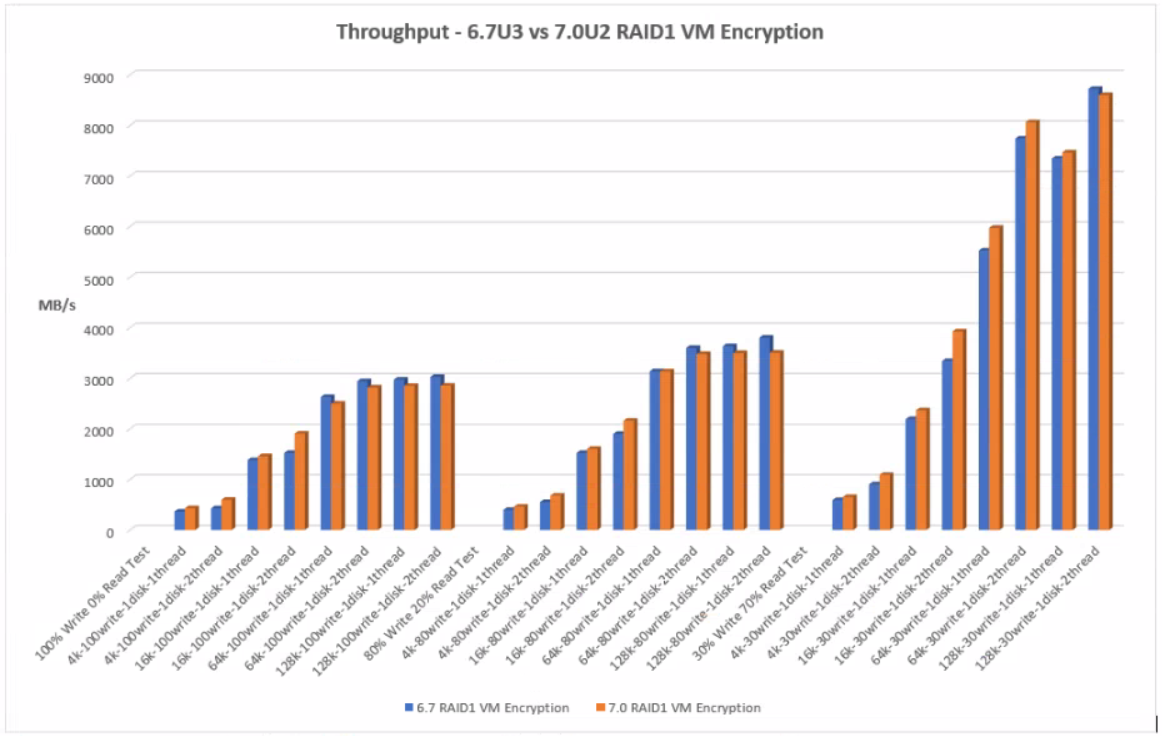
With RAID1 VM Encryption at at lower block sizes, 4k and 16k, 7.0U2 performs better with greater throughput. At the higher block sizes 64k and 128k, there is less of a difference with 6.7U3 performing slightly better but the increase is minimal.
With RAID6 VM Encryption, there is generally a higher throughput at the lower block sizes but not at the higher block sizes
RAID1 VM Encryption
The graph below shows the comparison of throughput between 6.7U3 and 7.0U2 with RAID1 VM Encryption
Click the graph for an enlarged view
RAID6 VM Encryption
The graph below shows the comparison of throughput between 6.7U3 and 7.0U2 with RAID6 VM Encryption
Click the graph for an enlarged view
Average Latency
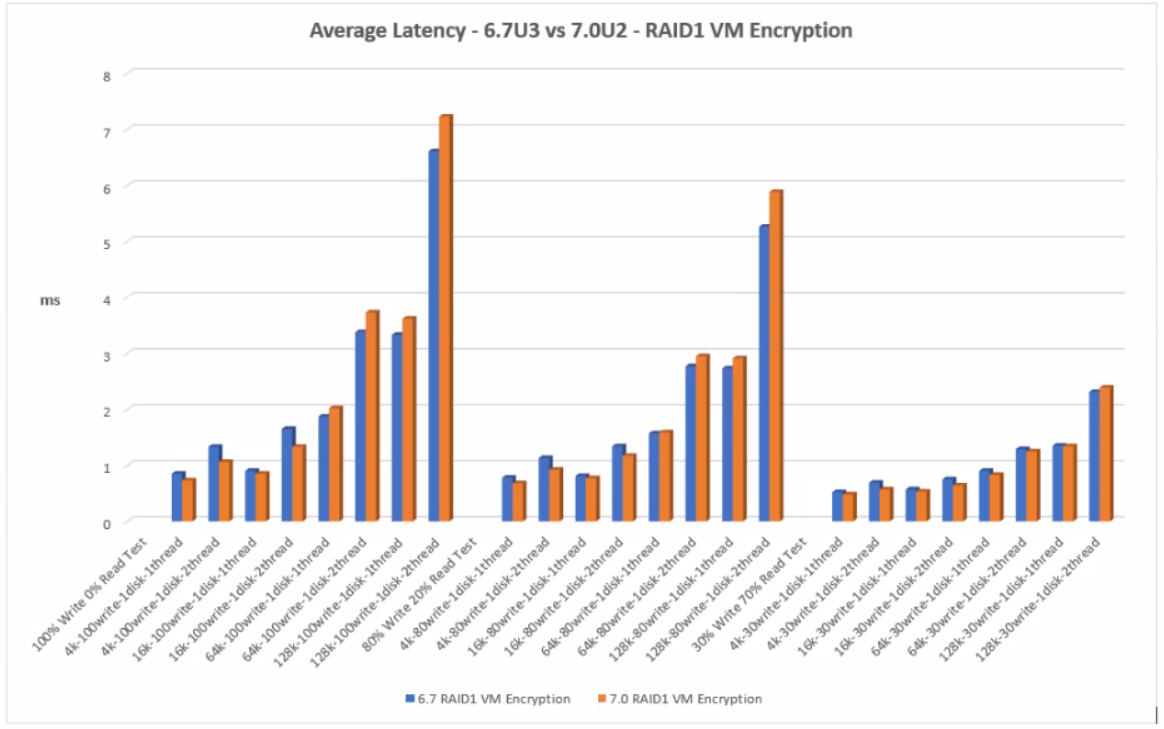
With RAID1 VM Encryption at at lower block sizes, 4k and 16k, 7.0U2 shows less latency but at the higher block sizes there is a slight increase in latency than 6.7U3
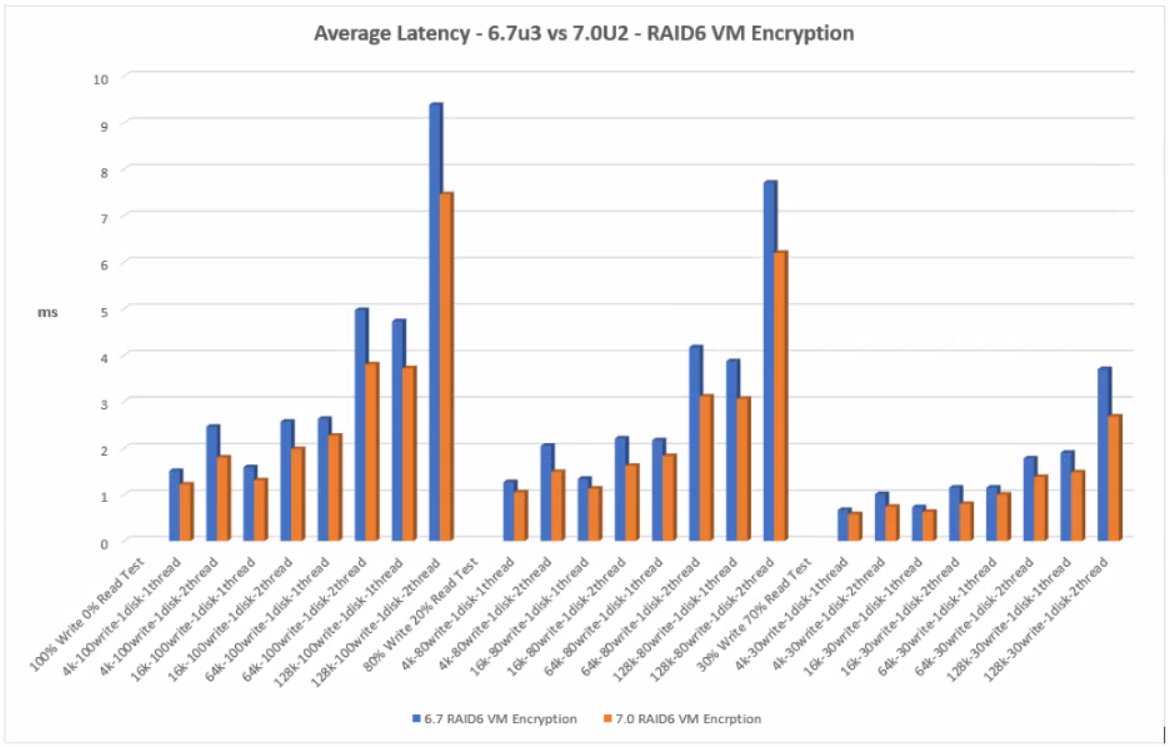
With RAID6 VM Encryption, the 7.0U2 tests are better showing less latency than the 6.7U3 tests
RAID1 VM Encryption
The graph below shows the comparison of average latency between 6.7U3 and 7.0U2 with RAID1 VM Encryption
Click the graph for an enlarged view
RAID6 VM Encryption
The graph below shows the comparison of average latency between 6.7U3 and 7.0U2 with RAID6 VM Encryption
Click the graph for an enlarged view
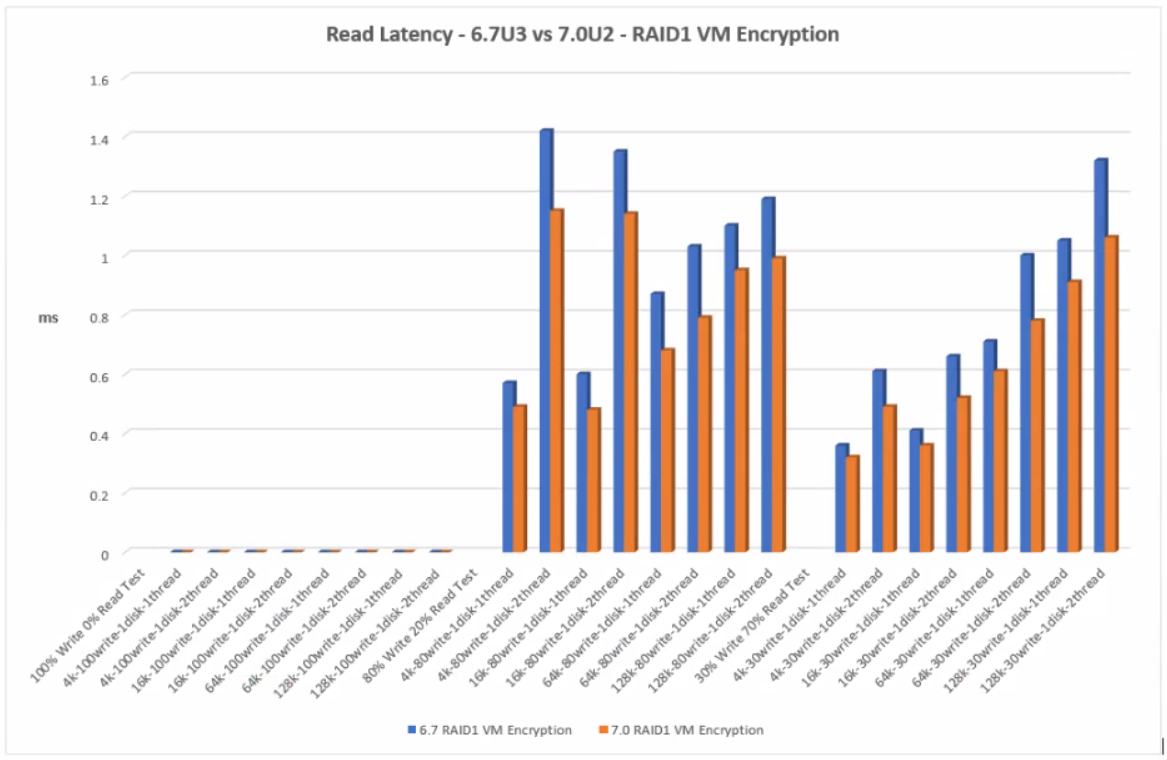
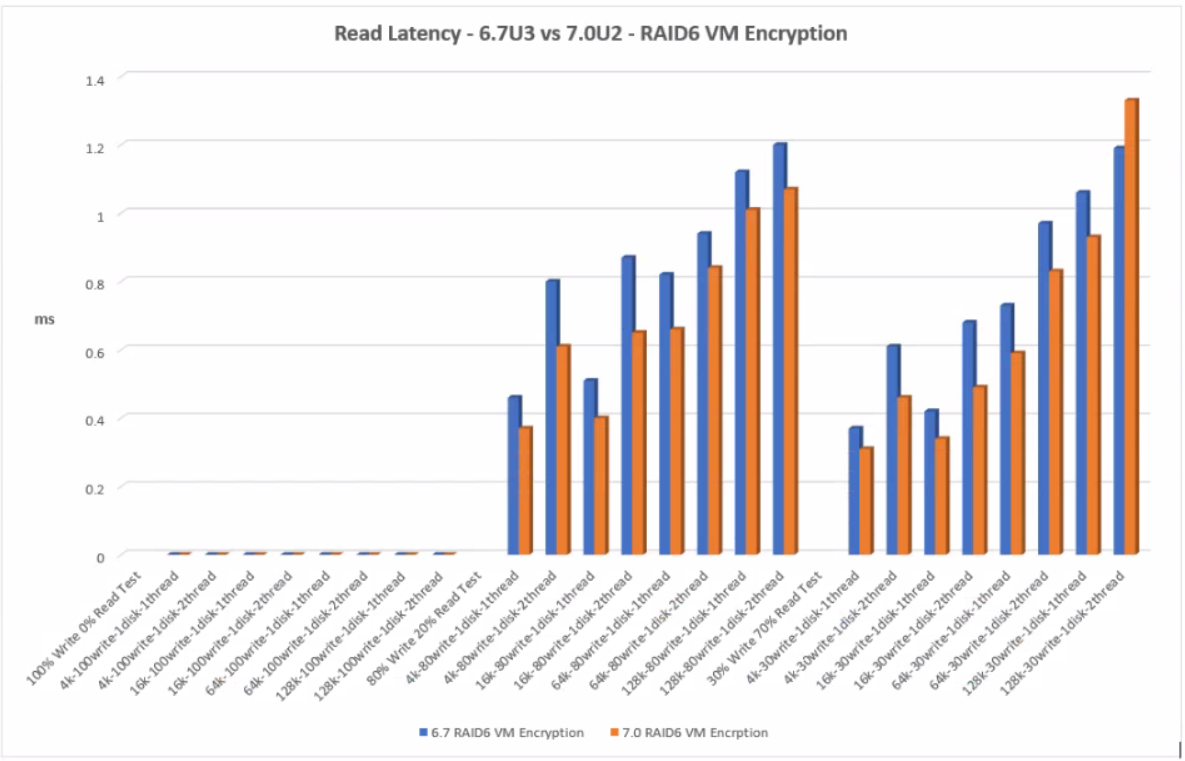
Read Latency
The pattern is consistent between the read/write workloads. As the workload decreases, read latency decreases although the figures are generally quite close. Read latency for all tests varies between 0.30 and 1.40ms which is under a generally recommended limit of 15-20ms before latency starts to cause performance problems.
RAID1 VM Encryption shows lower read latency for the 7.0U2 tests than 6.7U3. There are outlier values for the Read Latency across the 4K and 16K block size when testing 2 threads which may be something to note if applications will be used at these block sizes.
RAID6 shows a slightly better latency result than RAID1 however RAID6 has more disks than mirrored RAID1 disks to read from than RAID1 therefore the reads are very fast which is reflected in the results. Faster reads result in lower latency. Overall 7.0U2 performs better than 6.7U3 apart from one value at the 128k block size with 2 threads which may be an outlier.
RAID1 VM Encryption
Click the graph for an enlarged view
RAID6 VM Encryption
Click the graph for an enlarged view
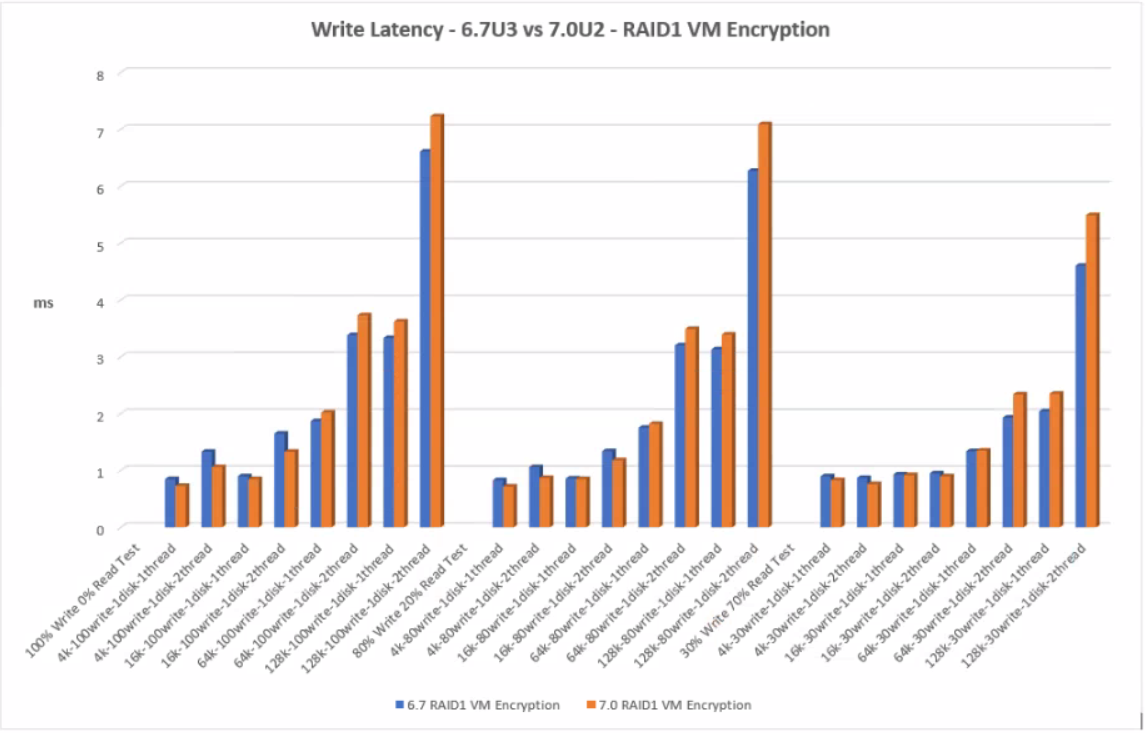
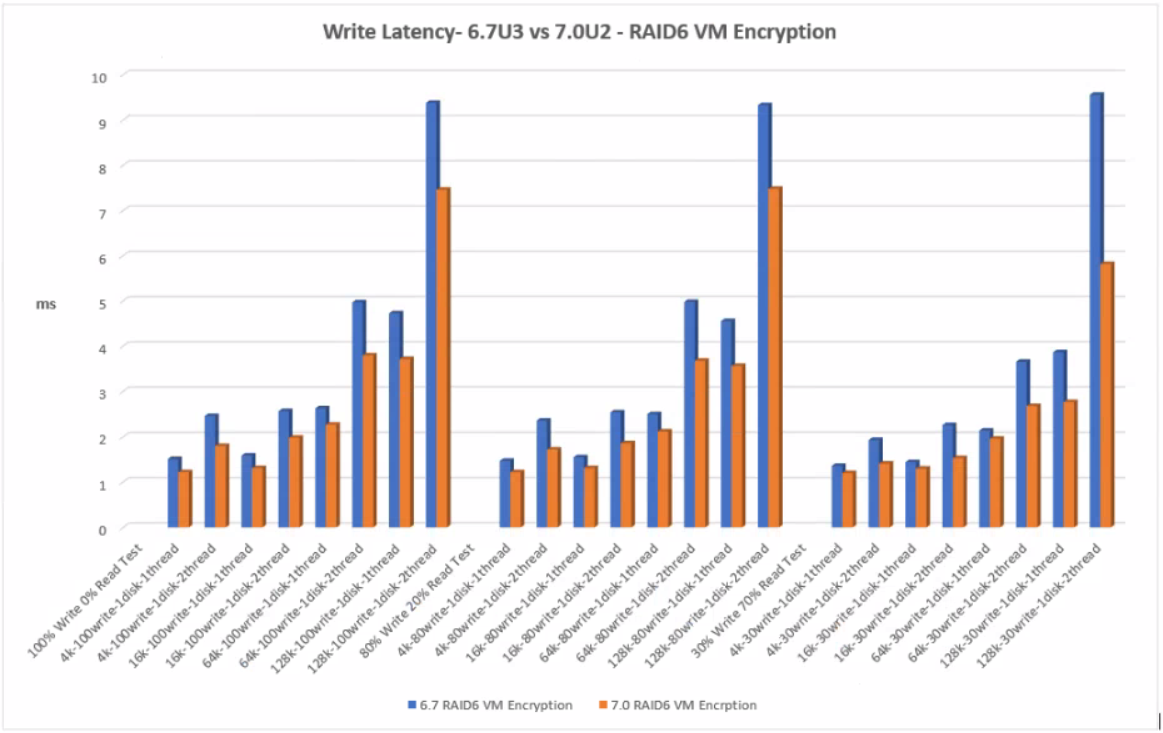
Write Latency
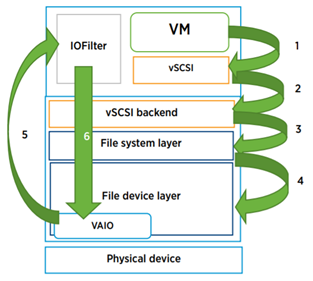
The lowest write latency is 0.72ms and the largest is 9.56ms. Up to 20ms is the recommended value from VMware however with all flash arrays, thse values are expected and well within these limits. With NVMe and flash disks, the faster hardware may expose bottlenecks elsewhere in hardware stack and architecture which can be compared with internal VMware host layer monitoring. Write latency can occur at several virtualization layers and filters which each cause their own latency. The layers can be seen below.
Latency can be caused by limits on the storage controller, queuing at the VMkernel layer, the disk IOPS limit being reached and the types of workloads being run possibly alongside other types of workloads which cause more processing.
With RAID1 Encryption, 7.0U2 performed better at the lower block size with less write latency than 6.7U3. However on the higher block sizes, 64k and 128k, 6.7U3 performs slightly better but we are talking 1-2ms.
With RAID6 VM Encryption, 7.0U2 performed well with less latency across all tests than 6.7U3.
As expected, all the RAID6 results incurred more write latency than the RAID1 results. Each RAID6 write operation requires the disks to read the data, read the first parity, read the second parity, write the data, write the first parity and then finally write the second parity producing a heavy write penalty and therefore more latency
RAID1 VM Encryption
Click the graph for an enlarged view
RAID6 VM Encryption
Click the graph for an enlarged view
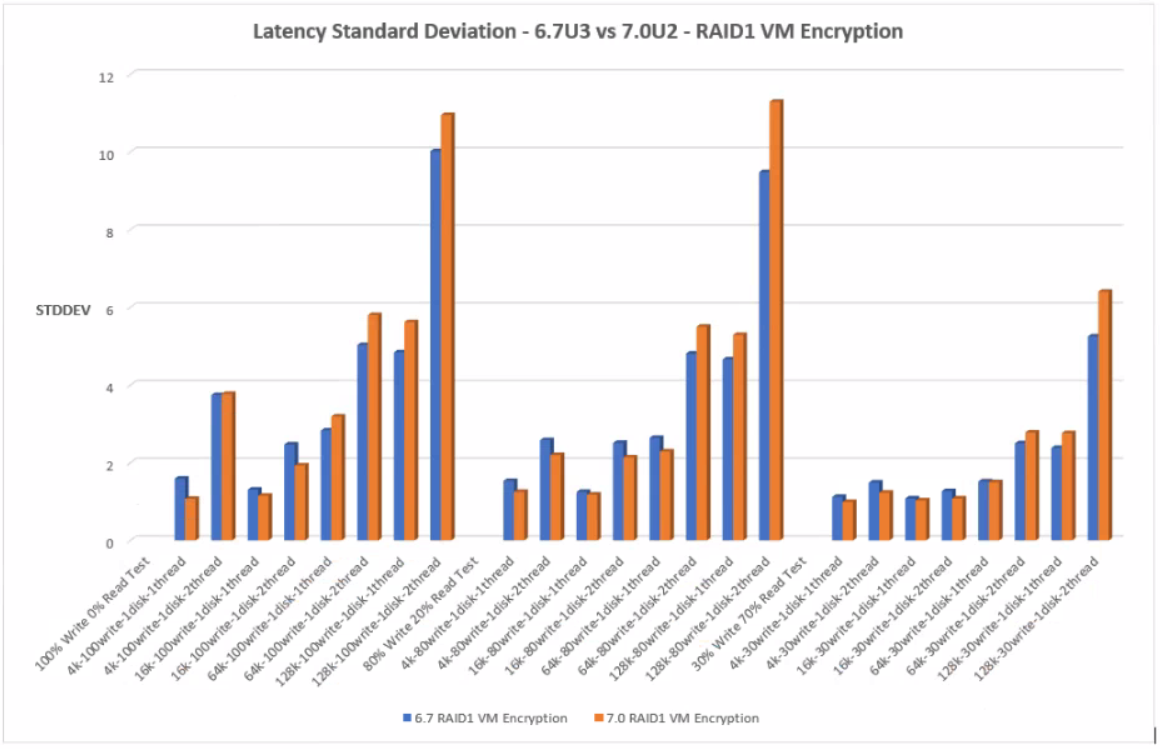
Latency Standard Deviation
The standard deviation value in the testing results uses a 95th percentile. This is explained below with examples.
An average latency of 2ms and a 95th percentile of 6ms means that 95% of the IO were serviced under 6ms, and that would be a good result
An average latency of 2ms and a 95th percentile latency of 200ms means 95% of the IO were serviced under 200ms (keeping in mind that some will be higher than 200ms). This means that latencies are unpredictable and some may take a long time to complete. An operation could take less than 2ms, but every once in a while, it could take well over 200
Assuming a good average latency, it is typical to see the 95th percentile latency no more than 3 times the average latency.
With RAID1 Encryption, 7.0U2 performed better at the lower block size with less latency standard deviation than 6.7U3. However on the higher block sizes, 64k and 128k, 6.7U3 performs slightly better.
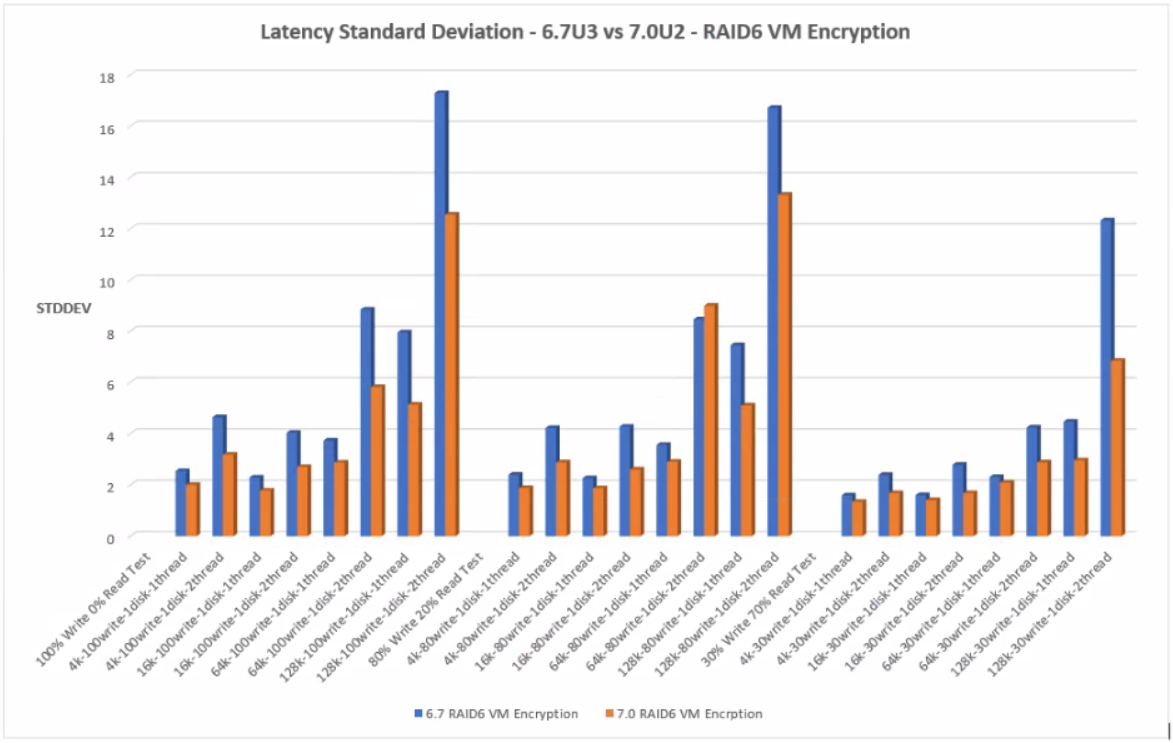
With RAID 6 VM Encryption, 7.0U2 performed with less standard deviation across all the tests.
RAID1 VM Encryption
Click the graph for an enlarged view
RAID6 VM Encryption
Click the graph for an enlarged view
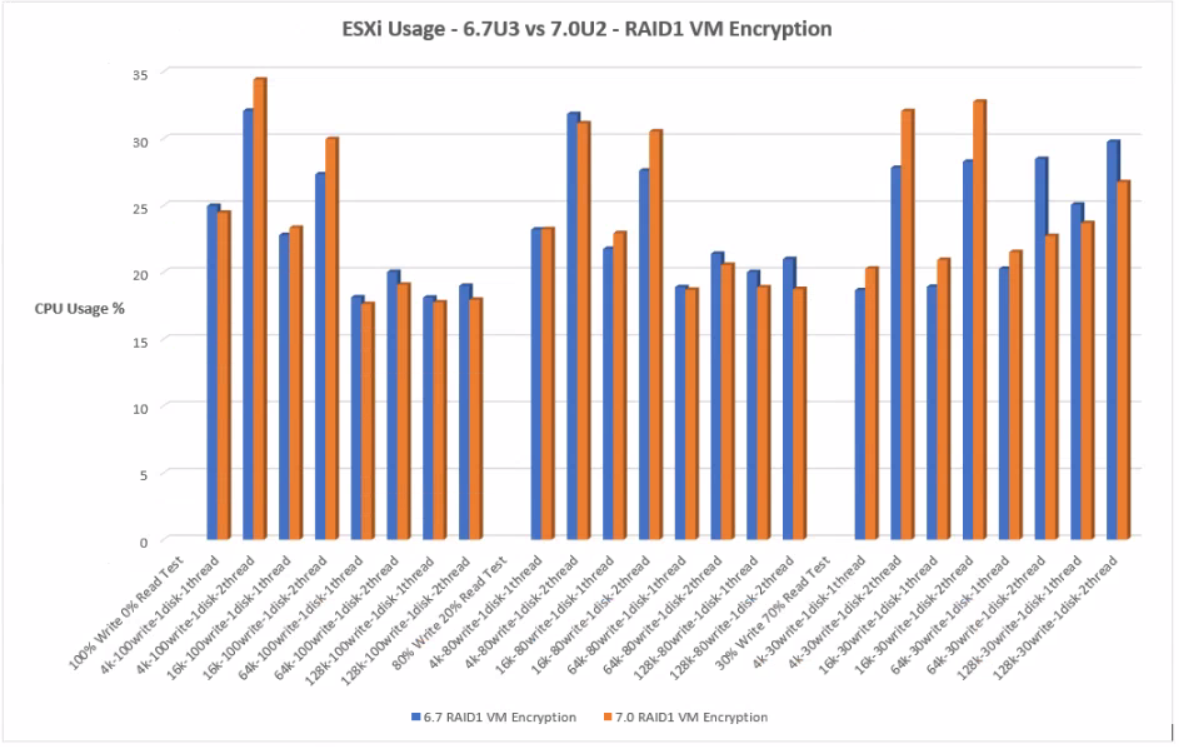
ESXi CPU Usage %
With RAID1 VM Encryption, at the lower block sizes, 4k and 16k, 7.0U2 uses more CPU but at the higher block sizes, 7.0U2 uses slightly less CPU usage.
With RAID6 VM Encryption, there is an increase in CPU usage across all 7.0U2 compared to 6.7U3 tests. RAID 6 has a higher computational penalty than RAID1.
RAID1 VM Encryption
Click the graph for an enlarged view
RAID6 VM Encryption
Click the graph for an enlarged view
Conclusion
The performance tests were designed to get an overall view from a low workload test of 30% Write, 70% Read through a series of increasing workload tests of 80% Write, 20% Read and 100% Write, 0% Read simulation. These tests used different block sizes to simulate different application block sizes. Testing was carried out on an all flash RAID1 and RAID6 vSAN datastore to compare the performance for VM encryption between ESXi 6.7U3 and 7.0U2. The environment was set up to vendor best practice across vSphere ESXi, vSAN, vCenter and the Dell server configuration.
RAID1 VM Encryption
With 6.7U3, IOPs at the higher block sizes, 64k and 128k can be slightly better than 7.0U2 but not at lower block sizes.
With 6.7U3, throughput at the higher block sizes, 64k and 128k can be slightly better than 7.0U2 but not at lower block sizes
Overall latency for 6.7U3 at the higher block sizes, 64k and 128k can be slightly better than 7.0U2 but not for the lower block size
Read latency for 6.7U3 is higher than 7.0U2.
Write latency at the higher block sizes, 64k and 128k can be slightly better than 7.0U2 but not for the lower block sizes.
There is more standard deviation for 6.7U3 then 7.0U2.
At the lower blocks sizes, 6.7U3 uses less CPU on the whole but at the higher block sizes, 7.0U2 uses less CPU
RAID6 VM Encryption
There are higher IOPs for 7.0U2 than 6.7U3 across all tests.
There is generally a higher throughput for 7.0U2 at the lower block sizes, than 6.7U3 but not at the higher block sizes. However, the difference is minimal.
There is lower overall latency for 7.0U2 than 6.7U3 across all tests
There is lower read latency for 7.0U2 than 6.7U3 across all tests
There is lower write latency for 7.0U2 than 6.7U3 across all tests
There is less standard deviation for 7.0U2 than 6.7U3 across all tests
There is a higher CPU % usage for 7.0U2 than 6.7U3 across all tests
With newer processors, AES improvements, memory improvements, RDMA NICs and storage controller driver improvements, we may see further performance improvements in new server models.
It has become a requirement for companies to enable protection of both personal identifiable information and data; including protecting other communications within and across environments New EU General Data Protection Regulations (GDPR) are now a legal requirement for global companies to protect the personal identifiable information of all European Union residents. In the last year, the United Kingdom has left the EU, however the General Data Protection Regulations will still be important to implement. “The Payment Card Industry Data Security Standards (PCI DSS) requires encrypted card numbers. The Health Insurance Portability and Accountability Act and Health Information Technology for Economic and Clinical Health Acts (HIPAA/HITECH) require encryption of Electronic Protected Health Information (ePHI).” (Townsendsecurity, 2019) Little is known about the effect encryption has on the performance of different data held on virtual infrastructure. VM encryption and vSAN encryption are the two data protection options I will evaluate for a better understanding of the functionality and performance effect on software defined storage.
It may be important to understand encryption functionality in order to match business and legal requirements. Certain regulations may need to be met which only specific encryption solutions can provide. Additionally, encryption adds a layer of functionality which is known to have an effect on system performance. With systems which scale into thousands, it is critical to understand what effect encryption will have on functionality and performance in large environments. It will also help when purchasing hardware which has been designed for specific environments to allow some headroom in the specification for the overhead of encryption.
What will be used to test
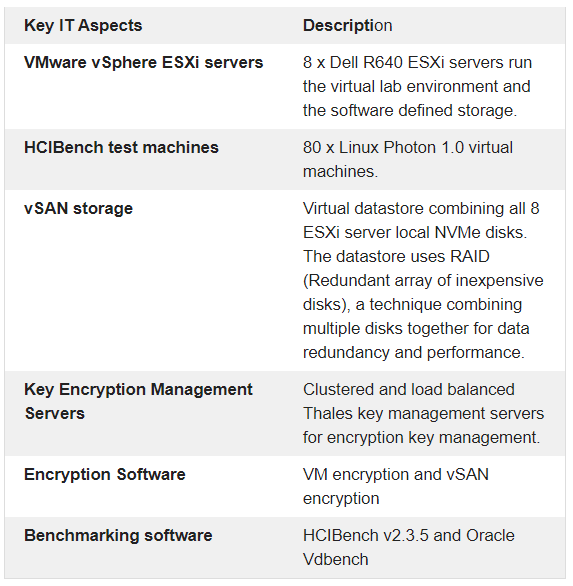
Key IT Aspects
Description
VMware vSphere ESXi servers
8 x Dell R640 ESXi servers run the virtual lab environment and the software defined storage.
HCIBench test machines
80 x Linux Photon 1.0 virtual machines.
vSAN storage
Virtual datastore combining all 8 ESXi server local NVMe disks. The datastore uses RAID (Redundant array of inexpensive disks), a technique combining multiple disks together for data redundancy and performance.
Key Encryption Management Servers
Clustered and load balanced Thales key management servers for encryption key management.
Encryption Software
VM encryption and vSAN encryption
Benchmarking software
HCIBench v2.3.5 and Oracle Vdbench
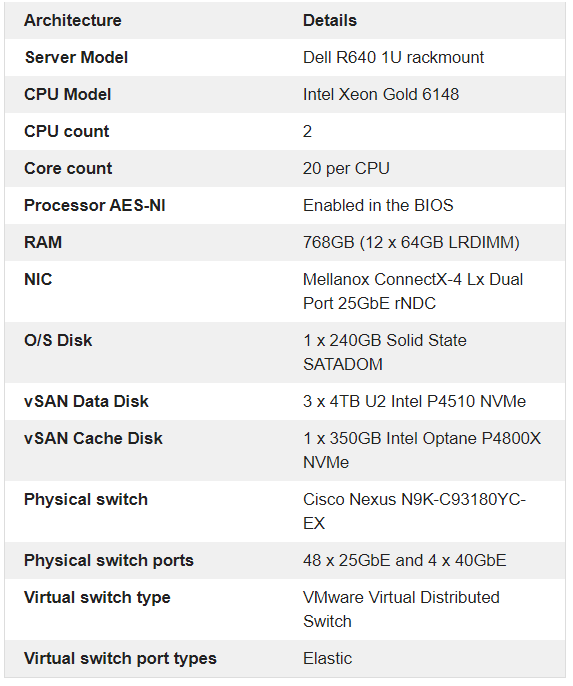
Test lab hardware
8 servers
Architecture
Details
Server Model
Dell R640 1U rackmount
CPU Model
Intel Xeon Gold 6148
CPU count
2
Core count
20 per CPU
Processor AES-NI
Enabled in the BIOS
RAM
768GB (12 x 64GB LRDIMM)
NIC
Mellanox ConnectX-4 Lx Dual Port 25GbE rNDC
O/S Disk
1 x 240GB Solid State SATADOM
vSAN Data Disk
3 x 4TB U2 Intel P4510 NVMe
vSAN Cache Disk
1 x 350GB Intel Optane P4800X NVMe
Physical switch
Cisco Nexus N9K-C93180YC-EX
Physical switch ports
48 x 25GbE and 4 x 40GbE
Virtual switch type
VMware Virtual Distributed Switch
Virtual switch port types
Elastic
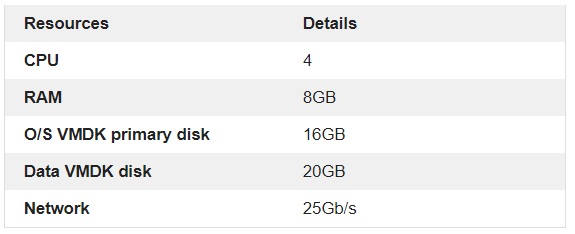
HCIBench Test VMs
80 HCIBench Test VMs will be used for this test. I have placed 10 VMs on each of the 8 Dell R640 servers to provide a balanced configuration. No virtual machines other than the HCIBench test VMs will be run on this system to avoid interference with the testing.
The specification of the 80 HCIBench Test VMs are as follows.
Resources
Details
CPU
4
RAM
8GB
O/S VMDK primary disk
16GB
Data VMDK disk
20GB
Network
25Gb/s
HCIBench Performance Metrics
Workload Parameter
Explanation
Value
IOPs
IOPS measures the number of read and write operations per second
Input/Outputs per second
Throughput
Throughput measures the number of bits read or written per second Average IO size x IOPS = Throughput in MB/s
MB/s
Read Latency
Latency is the response time when you send a small I/O to a storage device. If the I/O is a data read, latency is the time it takes for the data to come back
ms
Write Latency
Latency is the response time when you send a small I/O to a storage device. If the I/O is a write, latency is the time for the write acknowledgement to return.
ms
Latency Standard Deviation
Standard deviation is a measure of the amount of variation within a set of values. A low standard deviation indicates that the values tend to be close to the mean of the set, while a high standard deviation indicates that the values are spread out over a wider range
Values must be compared to the standard deviation
Average ESXi CPU usage
Average ESXi Host CPU usage
%
Average vSAN CPU usage
Average CPU use for vSAN traffic only
%
HCIBench Test Parameter Options
The HCIBench performance options allow you to set the block size and the types of read/write ratios. In these tests, I will be using the following block sizes to give a representation of the different types of applications you can see on corporate systems
4k
16k
64k
128k
In these tests I will be using the following Read/Write ratios to also give a representation of the different types of applications you can see on corporate systems
0% Read 100% Write
20% Read 80% Write
70% Read 30% Write
RAID Configuration
VM encryption will be tested on RAID1 and RAID6 vSAN storage
vSAN encryption will be tested on RAID1 and RAID6 vSAN storage
Note: vSAN encryption is not configured at all in the policy for vSAN encryption as this is turned on at the datastore level but we still need a generic RAID1 and RAID6 storage policy.
VM encryption RAID1 storage policy
Test Parameters
Configuration
vCenter Storage Policy
Name = raid1_vsan_policy Storage Type = vSAN Failures to tolerate = 1 (RAID 1) Thin provisioned = Yes Number of disk stripes per object = 1 Encryption enabled = Yes Deduplication and Compression enabled = No
VM encryption RAID6 storage policy
Test Parameters
Configuration
vCenter Storage Policy
Name = raid6_vsan_policy Storage Type = vSAN Failures to tolerate = 2 (RAID6) Thin provisioned = Yes Number of disk stripes per object = 1 Encryption enabled = Yes Deduplication and Compression enabled = No
vSAN encryption RAID1 storage policy
Test Parameters
Configuration
vCenter Storage Policy
Name = raid1_vsan_policy Storage Type = vSAN Failures to tolerate = 1 (RAID 1) Thin provisioned = Yes Number of disk stripes per object = 1 Deduplication and Compression enabled = No
vSAN encryption RAID6 storage policy
Test Parameters
Configuration
vCenter Storage Policy
Name = raid6_vsan_policy Storage Type = vSAN Failures to tolerate = 2 (RAID6) Thin provisioned = Yes Number of disk stripes per object = 1 Deduplication and Compression enabled = No
Test Plans
The table below shows one individual test plan I have created. This plan is replicated for each of the tests listed below. Scroll across at the bottom to see the whole table.
RAID1 Baseline
RAID1 VM Encryption
RAID1 vSAN Encryption
RAID6 Baseline
RAID6 VM Encryption
RAID6 vSAN Encryption
The tests were run for 3 hours each including a warm up and warm down period.
Test
Number of disks
Working Set %
Number of threads
Block size (k)
Read %
Write %
Random %
Test time (s)
1
2 (O/S and Data)
100%
1
4k
0
100
100
7200
2
2 (O/S and Data)
100%
2
4k
0
100
100
7200
3
2 (O/S and Data)
100%
1
4k
20
80
100
7200
4
2 (O/S and Data)
100%
2
4k
20
80
100
7200
5
2 (O/S and Data)
100%
1
4k
70
30
100
7200
6
2 (O/S and Data)
100%
2
4k
70
30
100
7200
7
2 (O/S and Data)
100%
1
16k
0
100
100
7200
8
2 (O/S and Data)
100%
2
16k
0
100
100
7200
9
2 (O/S and Data)
100%
1
16k
20
80
100
7200
10
2 (O/S and Data)
100%
2
16k
20
80
100
7200
11
2 (O/S and Data)
100%
1
16k
70
30
100
7200
12
2 (O/S and Data)
100%
2
16k
70
30
100
7200
13
2 (O/S and Data)
100%
1
64k
0
100
100
7200
14
2 (O/S and Data)
100%
2
64k
0
100
100
7200
15
2 (O/S and Data)
100%
1
64k
20
80
100
7200
16
2 (O/S and Data)
100%
2
64k
20
80
100
7200
17
2 (O/S and Data)
100%
1
64k
70
30
100
7200
18
2 (O/S and Data)
100%
2
64k
70
30
100
7200
19
2 (O/S and Data)
100%
1
128k
0
100
100
7200
20
2 (O/S and Data)
100%
2
128k
0
100
100
7200
21
2 (O/S and Data)
100%
1
128k
20
80
100
7200
22
2 (O/S and Data)
100%
2
128k
20
80
100
7200
23
2 (O/S and Data)
100%
1
128k
70
30
100
7200
24
2 (O/S and Data)
100%
2
128k
70
30
100
7200
Results
Click on the graphs for a larger view
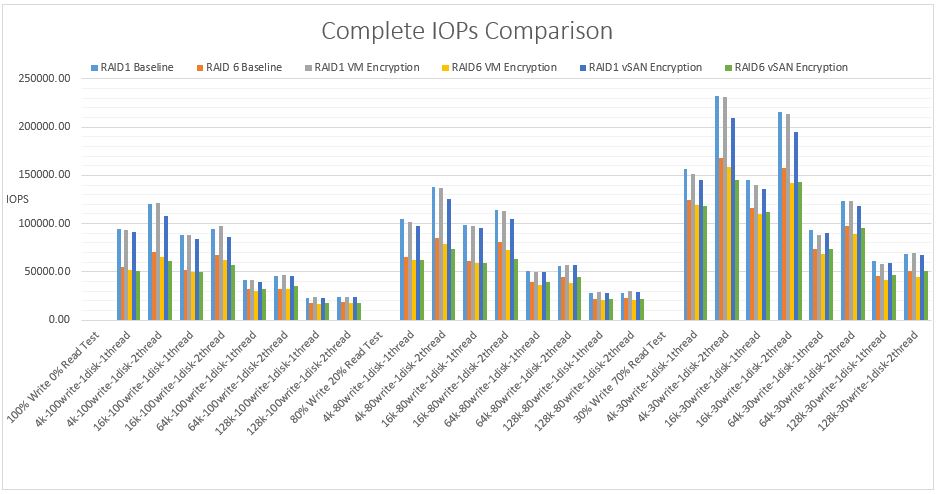
IOPS comparison for all RAID1 and RAID6 tests
IOPS measures the number of read and write operations per second. The pattern for the 3 different tests is consistent where the heavier write tests show the least IOPs gradually increasing in IOPs as the writes decrease. IOPS and block size tend to have an inverse relationship. As the block size increases, it takes longer latency to read a single block, and therefore the number of IOPS decreases however, smaller block sizes yield higher IOPS.
It is clear to see from the graphs that RAID1 VM encryption and RAID1 vSAN encryption produces more IOPS for all tests than RAID6 VM encryption and RAID6 vSAN encryption. This is expected due to the increased overhead RAID6 incurs over RAID1 in general. RAID 1 results in 2 writes, one to each mirror. A RAID6 single write operation results in 3 reads and 3 writes (due to double parity)
Each write operation requires the disks to read the data, read the first parity, read the second parity, write the data, write the first parity and then finally write the second parity.
RAID1 VM encryption outperforms RAID1 vSAN encryption in terms of IOPs. The RAID6 results are interesting where at the lower block sizes, RAID6 VM encryption outperforms RAID6 vSAN encryption however at the higher block sizes, RAID6 vSAN encryption outperforms VM encryption.
In order of the highest IOPs
RAID1 VM encryption
RAID1 vSAN encryption
RAID6 VM encryption
RAID 6 vSAN encryption
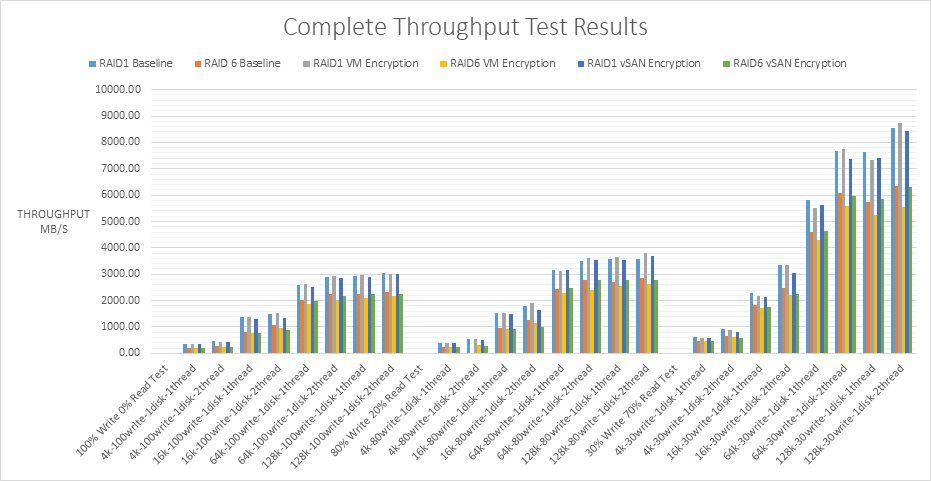
Throughput comparison for all RAID1 and RAID6 tests
IOPs and throughput are closely related by the following equation.
Throughput (MB/s) = IOPS * Block size
IOPS measures the number of read and write operations per second, while throughput measures the number of bits read or written per second. The higher the throughput, the more data which can be transferred. The graphs follow a consistent pattern from the heavier to the lighter workload tests. I can see the larger block sizes such as 64K and 128K have the greater throughput in each of the workload tests than 4K or 8K. As the block sizes get larger in a workload, the number of IOPS will decrease. Even though it’s fewer IOPS, you’re getting more data throughput because the block sizes are bigger. The vSAN datastore is a native 4K system. It’s important to remember that storage systems may be optimized for different block sizes. It is often the operating system and applications which set the block sizes which then run on the underlying storage. It is important to test different block sizes on storage systems to see the effect these have.
RAID1 VM encryption has the best performance in terms of throughput against RAID1 vSAN encryption however the results are very close together.
RAID6 vSAN encryption has the best performance in terms of throughput against RAID6 VM encryption.
In order of highest throughput
RAID1 VM encryption
RAID1 vSAN encryption
RAID6 vSAN encryption
RAID6 VM encryption
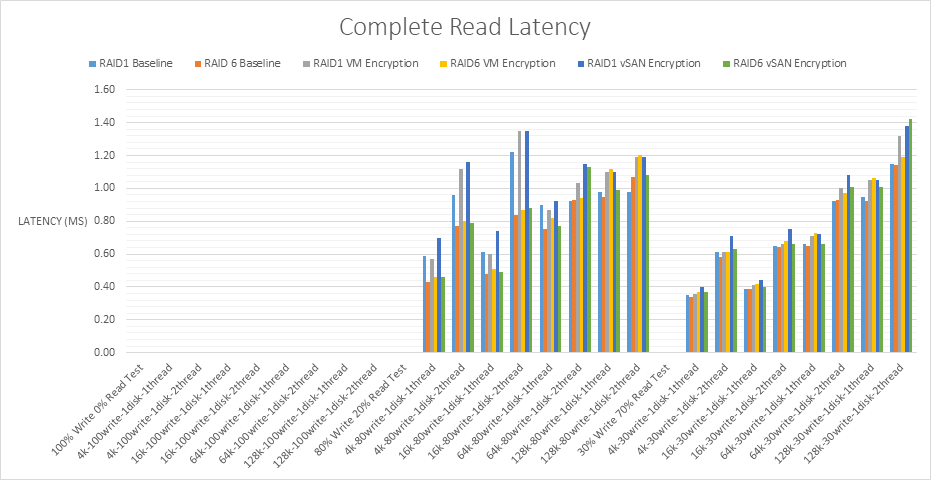
Read Latencycomparison for all RAID1 and RAID6 tests
The pattern is consistent between the read/write workloads. As the workload decreases, read latency decreases although the figures are generally quite close. Read latency for all tests varies between 0.40 and 1.70ms which is under a generally recommended limit of 15ms before latency starts to cause performance problems.
There are outlier values for the Read Latency across RAID1 VM Encryption and RAID1 vSAN encryption at 4K and 16K when testing 2 threads which may be something to note if applications will be used at these block sizes.
RAID1 vSAN encryption incurs a higher read latency in general than RAID1 VM encryption and RAID6 VM encryption incurs a higher read latency in general than RAID6 vSAN encryption however the figures are very close for all figures from the baseline.
RAID6 has more disks than mirrored RAID1 disks to read from than RAID1 therefore the reads are very fast which is reflected in the results. Faster reads result in lower latency.
From the lowest read latency to the highest
RAID6 vSAN encryption
RAID6 VM encryption
RAID1 VM encryption
RAID1 vSAN encryption
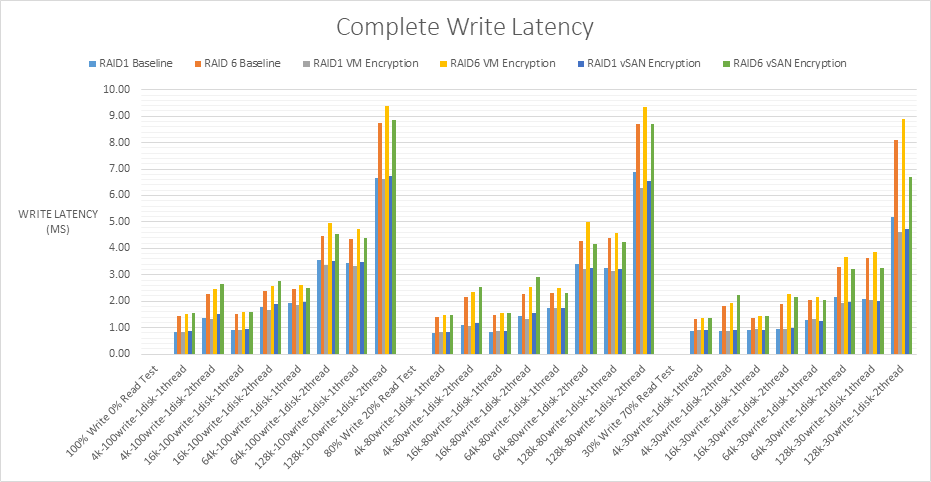
Write latency comparison for all RAID1 and RAID6 tests
The lowest write latency is 0.8ms and the largest is 9.38ms. Up to 20ms is the recommended value from VMware however with all flash arrays, this should be significantly lower which is what I can see from the results. With NVMe and flash disks, the faster hardware may expose bottlenecks elsewhere in hardware stack and architecture which can be compared with internal VMware host layer monitoring. Write latency can occur at several virtualization layers and filters which each cause their own latency. The layers can be seen below.
Latency can be caused by limits on the storage controller, queuing at the VMkernel layer, the disk IOPS limit being reached and the types of workloads being run possibly alongside other types of workloads which cause more processing.
The set of tests at the 100% write/0% read and 80% write/20% read have nearly no change in the write latency but it does decrease more significantly for the 30% write/70% read test.
As expected, all the RAID6 results incurred more write latency than the RAID1 results. Each RAID6 write operation requires the disks to read the data, read the first parity, read the second parity, write the data, write the first parity and then finally write the second parity producing a heavy write penalty and therefore more latency.
When split into the RAID1 VM encryption and RAID1 vSAN encryption results, RAID1 VM encryption incurs less write latency than RAID1 vSAN encryption however the values are very close.
When split into the RAID6 VM encryption and RAID6 vSAN encryption results, RAID6 VM encryption seems to perform with less write latency at the lower block sizes however performs with more write latency at the higher block sizes than RAID6 vSAN encryption.
From the lowest write latency to the highest.
RAID1 VM encryption
RAID1 vSAN encryption
RAID6 vSAN encryption
RAID6 VM encryption
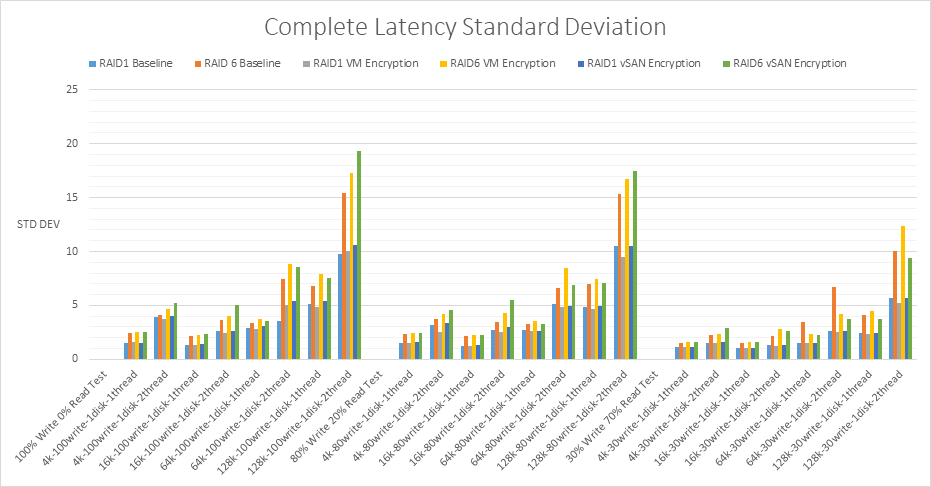
Latency Standard Deviation comparison for all RAID1 and RAID6 tests
The standard deviation value in the testing results uses a 95th percentile. This is explained below with examples.
An average latency of 2ms and a 95th percentile of 6ms means that 95% of the IO were serviced under 6ms, and that would be a good result
An average latency of 2ms and a 95th percentile latency of 200ms means 95% of the IO were serviced under 200ms (keeping in mind that some will be higher than 200ms). This means that latencies are unpredictable and some may take a long time to complete. An operation could take less than 2ms, but every once in a while, it could take well over 200
Assuming a good average latency, it is typical to see the 95th percentile latency no more than 3 times the average latency.
I analysed the results to see if the 95th percentile latency was no more than 3 times the average latency for all tests. I added new columns for multiplying the latency figures for all tests by 3 then comparing this to the standard deviation figure. The formula for these columns was =sum(<relevant_latency_column*3)
In the 80% write, 20% read test for the 64K RAID1 Baseline there was one result which was more than 3 times the average latency however not by a significant amount. In the 30% write, 70% read test for the 64K RAID6 Baseline, there were two results which were more than 3 times the average latency however not by a significant amount.
For all the RAID1 and RAID6 VM encryption and vSAN encryption tests, all standard deviation results overall were less than 3 times the average latency indicating that potentially, AES-NI may give encryption a performance enhancement which prevents significant latency deviations.
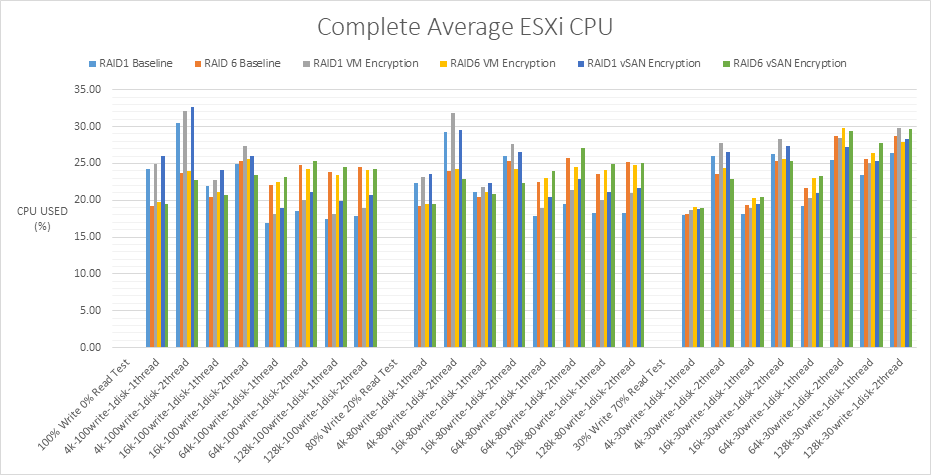
ESXi CPU usage comparison for all RAID1 and RAID6 tests
I used a percentage change formula on the ESXi CPU usage data for all tests. Percentage change differs from percent increase and percent decrease formulas because both directions of the change (Negative or positive) are seen. VMware calculated that using a percentage change formula, that VM encryption added up to 20% overhead to CPU usage (This was for an older vSphere O/S). There are no figures for vSAN encryption from VMware so I have used the same formula for all tests. I used the formula below to calculate the percentage change for all tests.
% change = 100 x (test value – baseline value)/baseline value
The lowest percentage change is -7.73% and the highest percentage change is 18.37% so the tests are all within VMware’s recommendation that encryption can add up to 20% more server CPU usage. Interestingly when the figures are negative, it shows an improvement over the baseline. This could be due to the way AES-NI boosts performance when encryption is enabled. RAID6 VM Encryption and vSAN encryption show more results which outperformed the baseline in these tests than RAID1 VM Encryption and vSAN encryption.
What is interesting about the RAID1 vSAN encryption and RAID6 vSAN encryption figures is that RAID1 vSAN encryption CPU usage goes up between 1 and 2 threads however RAID6 vSAN encryption CPU usage goes down between 1 and 2 threads.
Overall, there is a definite increase in CPU usage when VM encryption or vSAN encryption is enabled for both RAID1 and RAID6 however from looking at graphs, the impact is minimal even at the higher workloads.
RAID6 VM encryption uses less CPU at the higher block sizes than RAID6 vSAN encryption.
From the lowest ESXi CPU Usage to the highest.
RAID6 VM encryption
RAID6 vSAN encryption
RAID1 VM encryption
RAID1 vSAN encryption
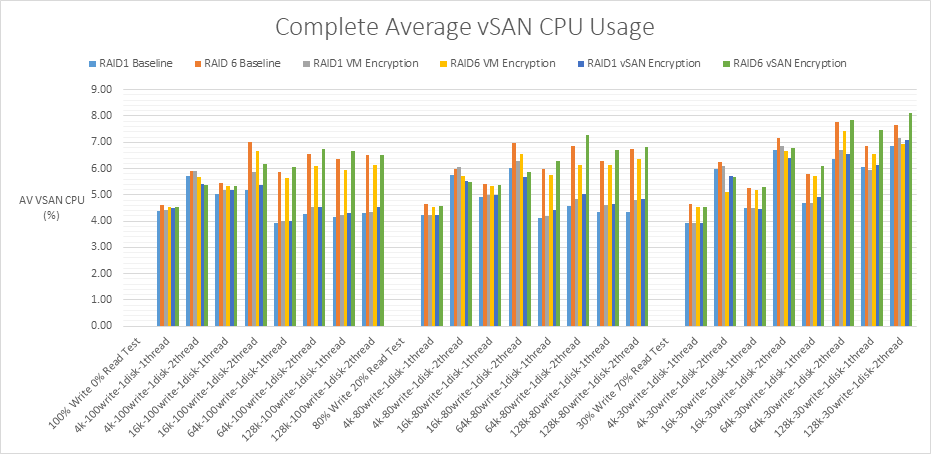
vSAN CPU usage comparison for all RAID1 and RAID6 tests
For the vSAN CPU usage tests. I used a percentage change formula on the data for the vSAN CPU usage comparison tests. Percentage change differs from percent increase and percent decrease formulas because I can see both directions of the change (Negative or positive) Negative values indicate the vSAN CPU usage with encryption performed better than the baseline. VMware calculated that using a percentage change formula, that VM encryption would add up to 20% overhead. There are no figures for vSAN encryption from VMware so I have used the same formula for these tests also.
% change = 100 x (test value – baseline value)/baseline value
The lowest percentage change is -21.88% and the highest percentage change is 12.50% so the tests are all within VMware’s recommendation that encryption in general can add up to 20% more CPU usage. Interestingly when the figures are negative, it shows an improvement over the baseline. This could be due to the way AES-NI boosts performance when encryption is enabled.
RAID1 VM encryption and RAID1 vSAN encryption uses more vSAN CPU than RAID6 VM encryption and RAID6 vSAN encryption. All of the RAID6 VM encryption figures performed better than the RAID6 baseline with the majority of RAID6 vSAN encryption figures performing better than the baseline. In comparison RAID1 VM encryption and RAID1 vSAN encryption nearly always used more CPU than the RAID1 baseline.
From the lowest vSAN CPU usage to the highest.
RAID6 VM encryption
RAID6 vSAN encryption
RAID1 vSAN encryption
RAID1 VM encryption
Conclusion
The following pages provide a final conclusion on the comparison between the functionality and performance of VM Encryption and vSAN Encryption.
Functionality
The main functionality differences can be summed up as follows
The DEK key is stored encrypted in the VMX file/VM advanced settings.
vSAN and VM encryption use the exact same encryption and kmip libraries but they have very different profiles. VM Encryption is a per-VM encryption.
VM Encryption utilizes the vCenter server for key management server key transfer. The hosts do not contact the key management server. vCenter only is a licensed key management client reducing license costs.
Enabled on a virtual cluster datastore level. Encryption is happening at different places in the hypervisor’s layers.
Data travels unencrypted, but it is written encrypted to the cache layer.
Full compatibility with deduplication and compression.
More complicated to set up with a key management server as each vendor has a different way of managing the trust between the key management server the vCenter Server.
The DEK key is stored encrypted in metadata on each disk.
vSAN and VM encryption use the exact same libraries but they have very different profiles.
VM Encryption utilizes the vCenter server for key management server key transfer. The hosts do not contact the key management server. vCenter only is a licensed key management client reducing license costs.
vSAN only, no other storage is able to be used for vSAN encryption.
Functionality conclusion
VM encryption and vSAN encryption are similar in some functionality. Both use a KMS server, both support RAID1, RAID5 and RAID6 encryption and both use the same encryption libraries and the kmip protocol. However, there are some fundamental differences. VM encryption gives the flexibility of encrypting individual virtual machines on a datastore opposed to encrypting a complete datastore with vSAN encryption where all VMs will automatically be encrypted. Both solutions provide data at rest encryption but only VM encryption provides end to end encryption as it writes an encrypted data stream whereas vSAN encryption receives an unencrypted data stream and encrypts it during the write process. Due to this level at which data is encrypted at, VM encryption cannot be used with features such as deduplication and compression however vSAN encryption can. It depends if this functionality is required and if the space which could be saved was significant. VM encryption is datastore independent and can use vSAN, NAS, FC and iSCSi datastores. vSAN encryption can only be used on virtual machines on a vSAN datastore. Choosing the encryption depends on whether different types of storage reside in the environment and whether they require encryption.
The choice between VM encryption functionality and vSAN encryption functionality will be on a use case dependency of whether individual virtual machine encryption control is required and/or whether there is other storage in an organization targeted for encryption. If this is the case, VM encryption will be best. If these factors are not required and deduplication and compression are required, then vSAN encryption is recommended.
Performance conclusion
The performance tests were designed to get an overall view from a low workload test of 30% Write, 70% Read through a series of increasing workload tests of 80% Write, 20% Read and 100% Write, 0% Read simulation. These tests used different block sizes to simulate different application block sizes. Testing was carried out on an all flash RAID1 and RAID6 vSAN datastore to compare the performance for VM encryption and vSAN encryption. The environment was set up to vendor best practice across vSphere ESXi, vSAN, vCenter and the Dell server configuration.
It can be seen in all these tests that performance is affected by the below factors.
Block size.
Workload ratios.
RAID level.
Threads used
Application configuration settings.
Access pattern of the application.
The table below shows a breakdown of the performance but in some cases the results are very close
Metric
1st
2nd
3rd
4th
IOPs
RAID1 VM encryption
RAID1 vSAN encryption
RAID6 VM encryption
RAID6 vSAN encryption
Throughput
RAID1 VM encryption
RAID1 vSAN encryption
RAID6 vSAN encryption
RAID6 VM encryption
Read Latency
RAID6 vSAN encryption
RAID6 VM encryption
RAID1 VM encryption
RAID1 vSAN encryption
Write Latency
RAID1 VM encryption
RAID1 vSAN encryption
RAID6 vSAN encryption
RAID6 VM encryption
Standard Dev
All standard deviation results were less than 3 times the average latency which is recommended with minor outliers
All standard deviation results were less than 3 times the average latency which is recommended with minor outliers
All standard deviation results were less than 3 times the average latency which is recommended with minor outliers
All standard deviation results were less than 3 times the average latency which is recommended with minor outliers
ESXi CPU Usage
RAID6 VM encryption
RAID6 vSAN encryption
RAID1 VM encryption
RAID1 vSAN encryption
vSAN CPU Usage
RAID6 VM encryption
RAID6 vSAN encryption
RAID1 vSAN encryption
RAID1 VM encryption
In terms of IOPs, RAID1 VM encryption produces the highest IOPS for all tests. This is expected due to the increased overhead RAID6 incurs over RAID1 in general. RAID 1 results in 2 writes, one to each mirror. A RAID6 single write operation results in 3 reads and 3 writes (due to double parity) causing more latency decreasing the IOPs.
In terms of throughput, RAID1 VM encryption produces the highest throughput for all tests. It is expected that by producing the highest IOPs in the majority of tests would mean it would produce a similar result for the throughput. Depending on whether your environment needs larger IOPs or larger throughput depends on the block sizing. Larger block sizes produce the best throughput due to getting more data through the system in bigger blocks. As the block size increases, it takes longer latency to read a single block, and therefore the number of IOPS decreases however, smaller block sizes yield higher IOPS.
In terms of read latency, RAID6 vSAN encryption performed best in the read latency tests. Read latency for all tests varies between 0.40 and 1.70ms which is under a generally recommended limit of 15ms before latency starts to cause performance problems. RAID6 has more disks than mirrored RAID1 disks to read from than RAID1 therefore the reads are very fast which is reflected in the results. Faster reads result in lower latency. The values overall were very close.
In terms of write latency, RAID1 VM encryption performed best. All the RAID6 results incurred more write latency than the RAID1 results which was to be expected. Each RAID6 write operation requires the disks to read the data, read the first parity, read the second parity, write the data, write the first parity and then finally write the second parity producing a heavy write penalty and therefore more latency. The lowest write latency is 0.8ms and the largest is 9.38ms. Up to 20ms is the recommended value therefore all tests were well within acceptable limits.
The performance of encrypted data also seems to be enhanced by the use of newer flash disks like SSDs and NVME showing latency figures which were within the acceptable values. SSD and NVMe uses a streamlined lightweight protocol compared to SAS, SCSI and AHC protocols while also reducing CPU cycles.
In terms of standard deviation, all standard deviation test results were less than 3 times the average latency which is recommended.
In terms of average ESXi CPU and vSAN CPU usage, RAID6 VM encryption produced the lowest increase in CPU. All encryption appeared to be enhanced by leveraging the AES-NI instructions in Intel and AMD CPU’s. The increase in CPU usage by the hosts and vSAN compared to the baseline for both sets of encryption tests is minimal and within acceptable margins by a considerable amount. In some cases, there was lower CPU use than the baseline possibly due to the AES-NI offload.
Encryption recommendation
Overall RAID1 VM encryption produces the best IOPs, throughput and write latency including the standard deviation metric values for latency being well under the acceptable limits. RAID1 ESXi CPU usage and vSAN CPU usage is higher than RAID6 however the difference is minimal when looking at the graphs especially in some cases where both sets of tests can outperform the baseline across the different block sizes. For applications which need very fast read performance, RAID6 will always be the best option due to having more disks than mirrored RAID1 disks to read from therefore this encryption should be matched to a specific application requirement if reads are a priority.
A vSAN Stretched Cluster is a specific configuration implemented in environments where disaster/downtime avoidance is a key requirement. Setting up a stretched cluster can be daunting. More in terms of the networking side than anything else. This blog isn’t meant to be chapter and verse on vSAN stretched clusters. It is meant to help anyone who is setting up the networking, static routes and ports required for a L2 and L3 implementation.
VMware vSAN Stretched Clusters with a Witness Host refers to a deployment where a user sets up a vSAN cluster with 2 active/active sites with an identical number of ESXi hosts distributed evenly between the two sites. The sites are connected via a high bandwidth/low latency link.
The third site hosting the vSAN Witness Host is connected to both of the active/active data-sites. This connectivity can be via low bandwidth/high latency links.
Each site is configured as a vSAN Fault Domain. The way to describe a vSAN Stretched Cluster configuration is X+Y+Z, where X is the number of ESXi hosts at data site A, Y is the number of ESXi hosts at data site B, and Z is the number of witness hosts at site C. Data sites are where virtual machines are deployed. The minimum supported configuration is 1+1+1(3 nodes). The maximum configuration is 15+15+1 (31 nodes). In vSAN Stretched Clusters, there is only one witness host in any configuration.
A virtual machine deployed on a vSAN Stretched Cluster will have one copy of its data on site A, a second copy of its data on site B and any witness components placed on the witness host in site C.
Types of networks
VMware recommends the following network types for Virtual SAN Stretched Cluster:
Management network: L2 stretched or L3 (routed) between all sites. Either option should both work fine. The choice is left up to the customer.
VM network: VMware recommends L2 stretched between data sites. In the event of a failure, the VMs will not require a new IP to work on the remote site
vMotion network: L2 stretched or L3 (routed) between data sites should both work fine. The choice is left up to the customer.
Virtual SAN network: VMware recommends L2 stretched between the two data sites and L3 (routed) network between the data sites and the witness site.
The major consideration when implementing this configuration is that each ESXi host comes with a default TCPIP stack, and as a result, only has a single default gateway. The default route is typically associated with the management network TCPIP stack. The solution to this issue is to use static routes. This allows an administrator to define a new routing entry indicating which path should be followed to reach a particular network. Static routes are needed between the data hosts and the witness host for the VSAN network, but they are not required for the data hosts on different sites to communicate to each other over the VSAN network. However, in the case of stretched clusters, it might also be necessary to add a static route from the vCenter server to reach the management network of the witness ESXi host if it is not routable, and similarly a static route may need to be added to the ESXi witness management network to reach the vCenter server. This is because the vCenter server will route all traffic via the default gateway.
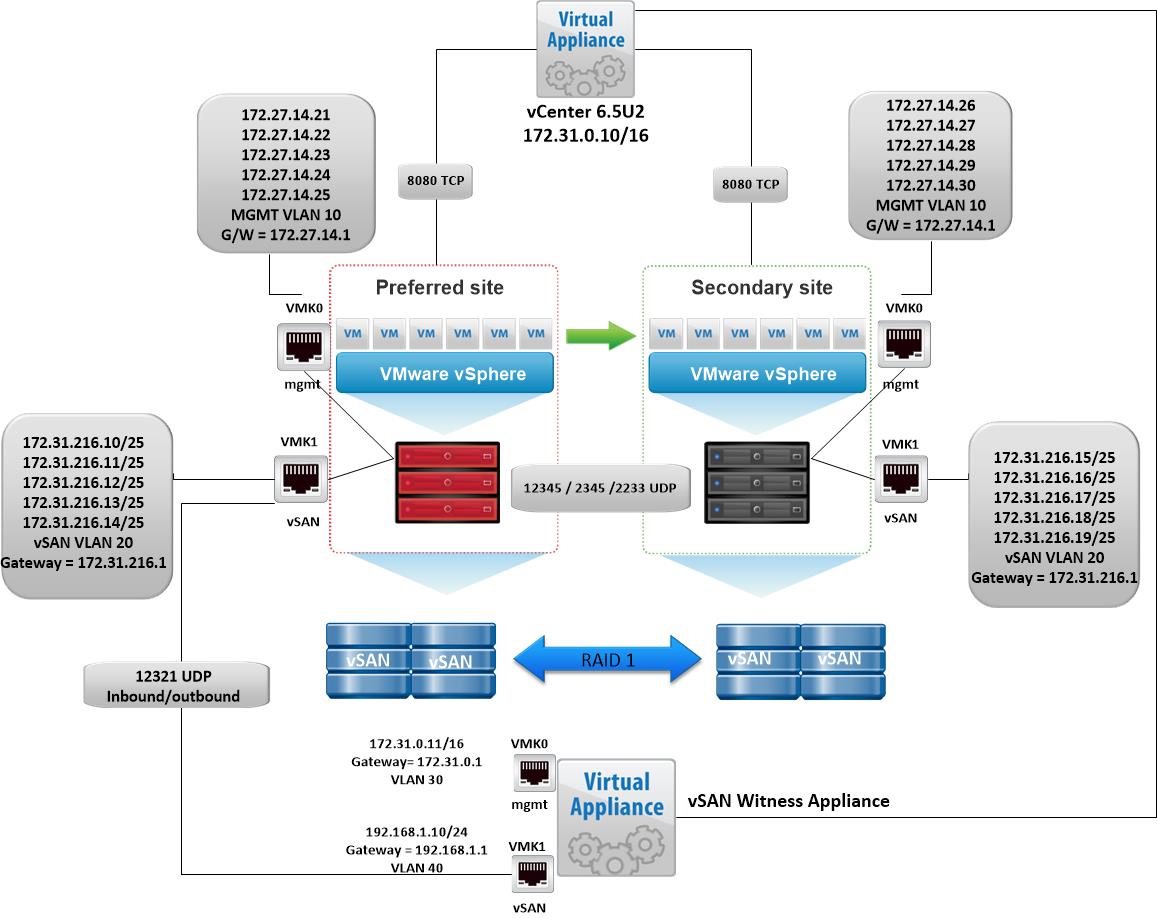
vSAN Stretched Cluster Visio diagram
The below diagram is for referring to and below this, the static routes are listed so it is clear what needs to connect.
Static Routes
The recommended static routes are
Hosts on the Preferred Site have a static route added so that requests to reach the witness network on the Witness Site are routed out the vSAN VMkernel interface
Hosts on the Secondary Site have a static route added so that requests to reach the witness network on the Witness Site are routed out the vSAN VMkernel interface
The Witness Host on the Witness Site have static route added so that requests to reach the Preferred Site and Secondary Site are routed out the WitnessPg VMkernel interface
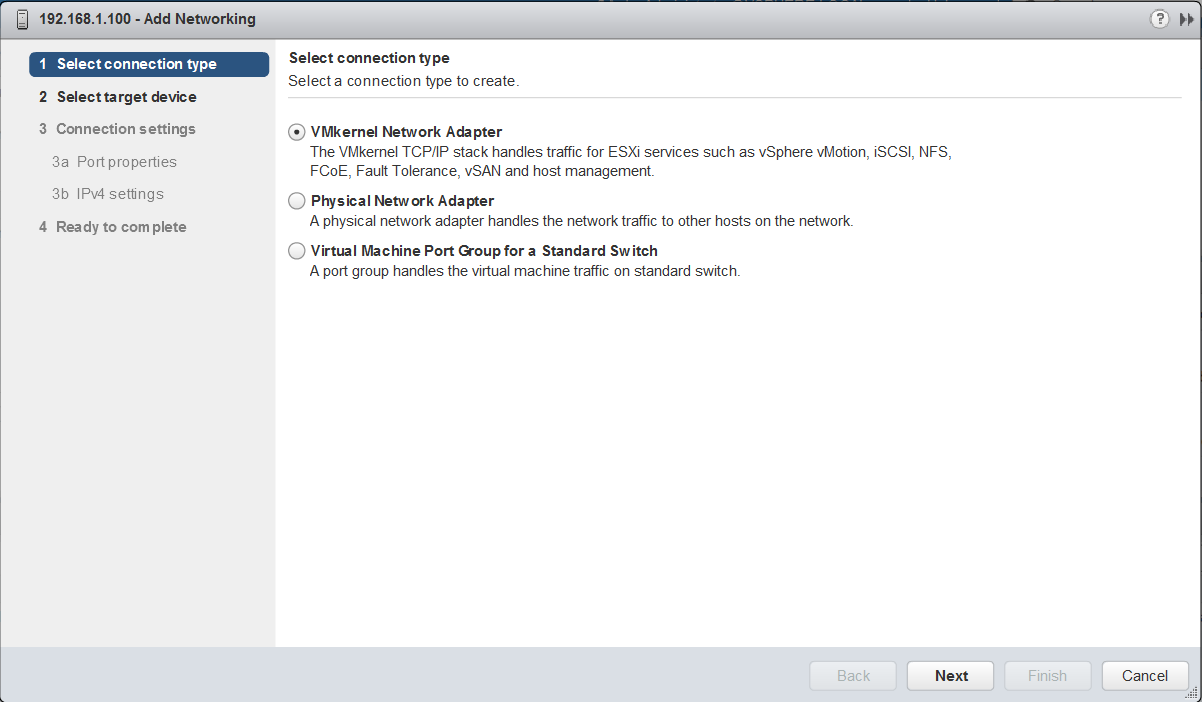
On each host on the Preferred and Secondary site
These were the manual routes added
esxcli network ip route ipv4 add -n 192.168.1.0/24-n vmk1 -g 172.31.216.1 (192.168.1.0 being the witness vsan network and 172.31.216.1 being the host vsan vmkernel address)
esxcli network ip route ipv4 list will show you the networking
vmkping -I vmk1 192.168.1.10 will confirm via ping that the network is reachable
On the witness
These were the manual routes added
esxcli network ip route ipv4 add -n 172.31.216.0/25 -n vmk1 -g 192.168.1.1 (172.31.216.0/25 being the host vsan vmkernel network and the gateway being the witness vsan vmkernel gateway)
esxcli network ip route ipv4 list will show you the networking
vmkping -I vmk1 172.31.216.10 will confirm via ping that the network is reachable
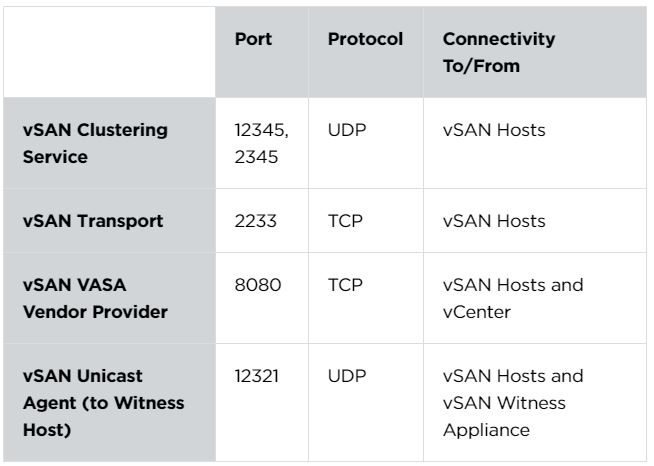
Port Requirements
Virtual SAN Clustering Service
12345, 23451 (UDP)
Virtual SAN Cluster Monitoring and Membership Directory Service. uses UDP-based IP multicast to establish cluster members and distribute Virtual SAN metadata to all cluster members. If disabled Virtual SAN does not work,
Virtual SAN Transport
2233 (TCP)
Virtual SAN reliable datagram transport. uses TCP and is used for Virtual SAN storage I/O. if disabled, Virtual SAN does not work
vSANVP
8080 (TCP)
vSAN VASA Vendor Provider. Used by the Storage Management Service (SMS) that is part of vCenter to access information about Virtual SAN storage profiles, capabilities and compliance. If disabled, Virtual SAN Storage Profile Based Management does not work
Virtual SAN Unicast agent to witness
12321 (UDP)
Self explanatory as needed for unicast from data nodes to witness.
vSAN Storage Hub
The link below is to the VMware Storage Hub which is the central location for all things vSAN including the vSAN stretched cluster guide which is exportable to PDF. Page 66/67 are relevant to networking/static routes.
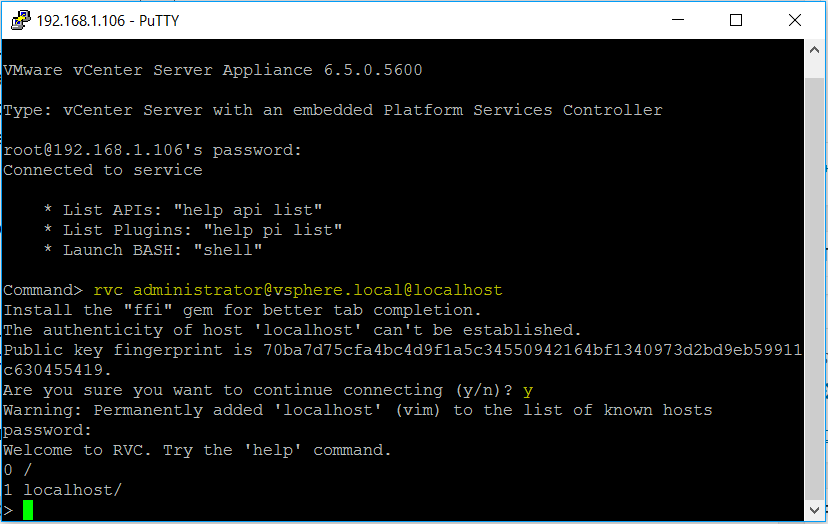
The Ruby vSphere Console (RVC) is an interactive command-line console user interface for VMware vSphere and Virtual Center.
The Ruby vSphere Console comes bundled with both the vCenter Server Appliance (VCSA) and the Windows version of vCenter Server. RVC is quickly becoming one of the primary tools for managing and troubleshooting Virtual SAN environments
How to begin
To begin using the Ruby vSphere Console to manage your vSphere infrastructure, deploy the vCenter Server Appliance and configure network connectivity for the appliance.
Afterwards, SSH using Putty or an app you prefer to the dedicated vCenter Server Appliance and login as a privileged user. No additional configuration is required to begin.
Commands such as ‘cd’ and ‘ls’ work fine and if you want to return to the previous directory type ‘cd .. and press Enter
How to Login
RVC credentials are directly related to the default domain setting in SSO (Single Sign-On). Verify the default SSO Identity Source is set to the desired entity.
So there are a few different ways to logon potentially either locally or with domain credentials. Examples below
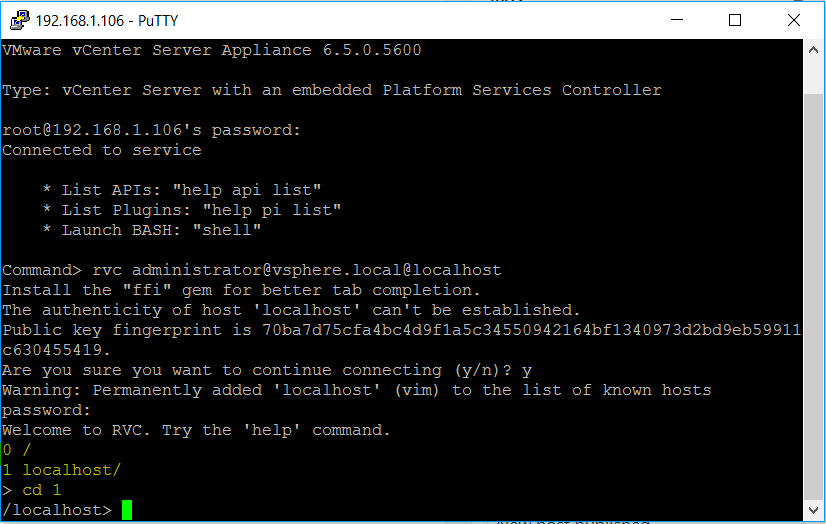
rvc administrator@vsphere.local@localhost
rvc root@localhost
rvc administrator@techlab.local@localhost
Where to go from here
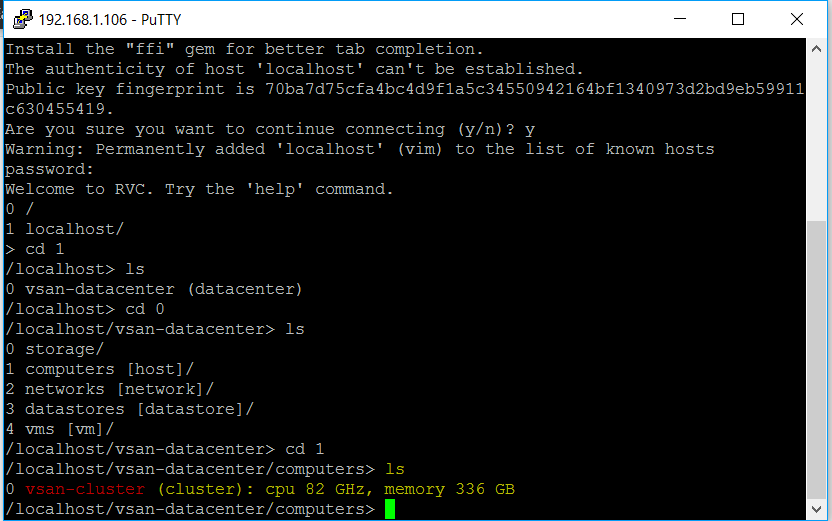
You are now at the root of the virtual filesystem.
To access and navigate through the system type ‘cd 0‘ to access the root (/) directory or ‘cd 1‘ to access the ‘localhost/’ directory. You can type the ‘ls’ command to list the contents of a directory. I am going to type ‘cd 1‘ to access my localhost directory so lets see what we have.
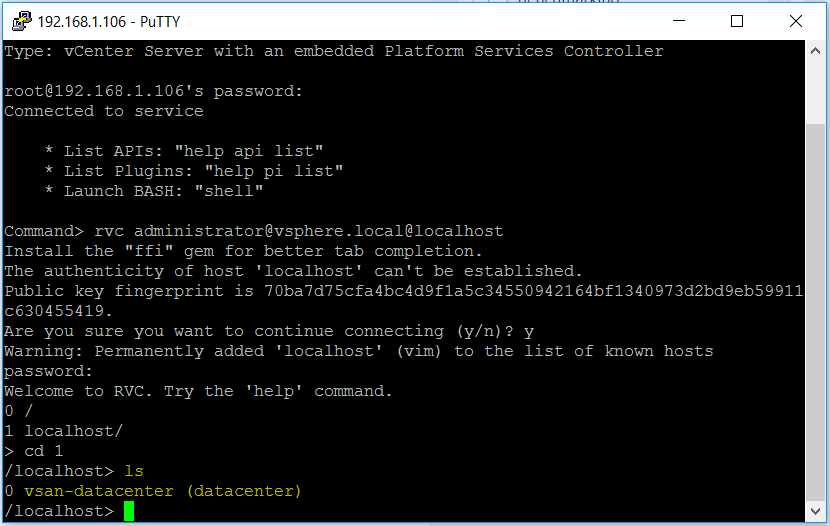
Type ls to see what directory structure we have now. You should now see your datacenter or datacenters
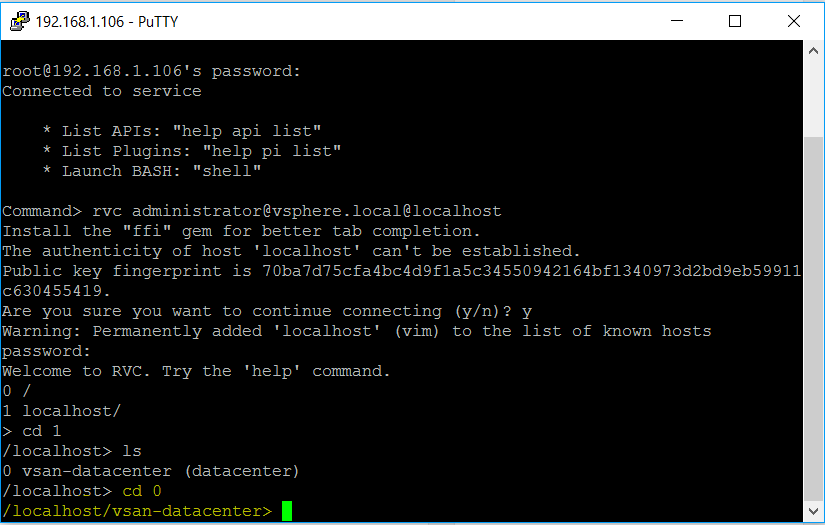
Change directory by typing cd 0 to the relevant datacenter and you will now see the following folder structure.
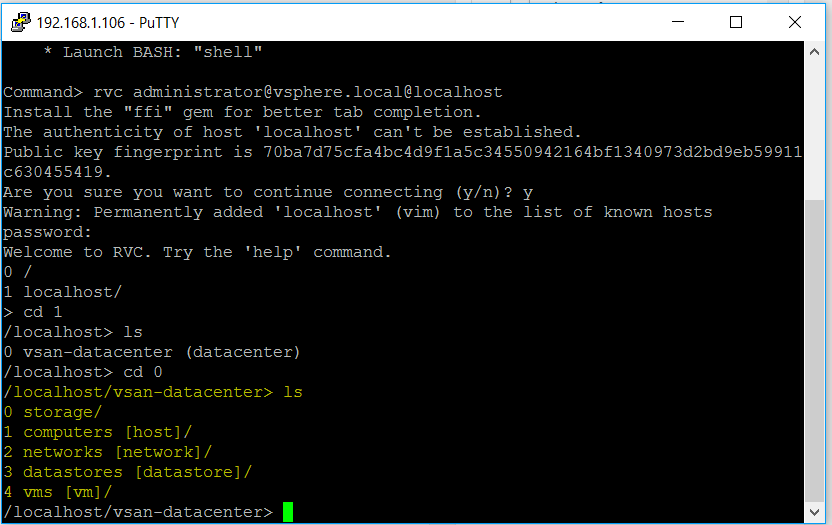
Type ls to see the structure of this folder
Type cd 1 to change to the Computers folder where we will see the cluster and then type ls
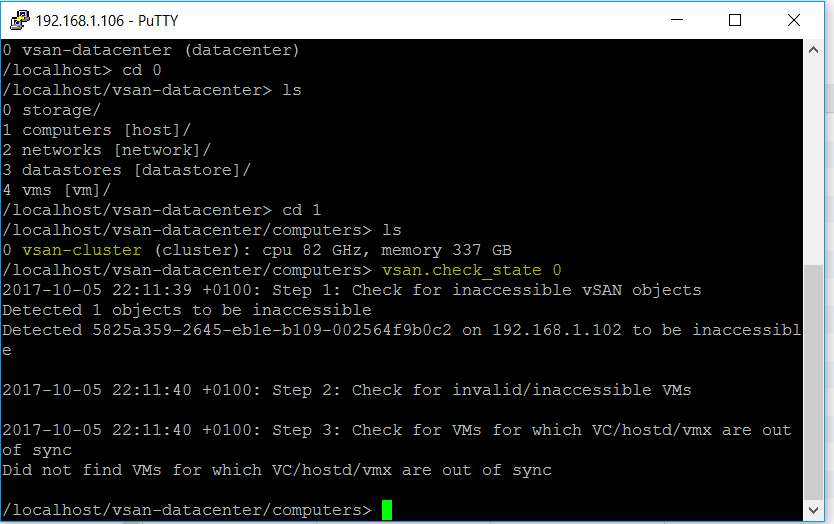
We can now use a command to check the state of the vSAN cluster. You don’t want to enter the command ‘vsan.check_state vsan-cluster’ as that will not work. The number ‘0’ is what you need to use to look at the state of the cluster so type vsan.check_state 0
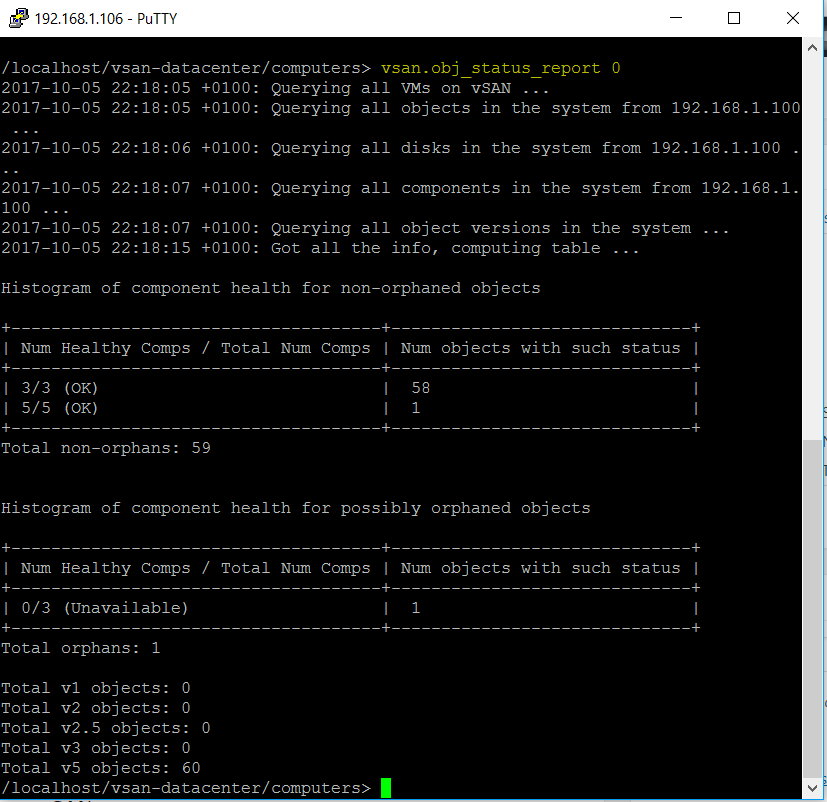
Next look at the vSAN Object Status Report. Type vsan.obj_status_report 0
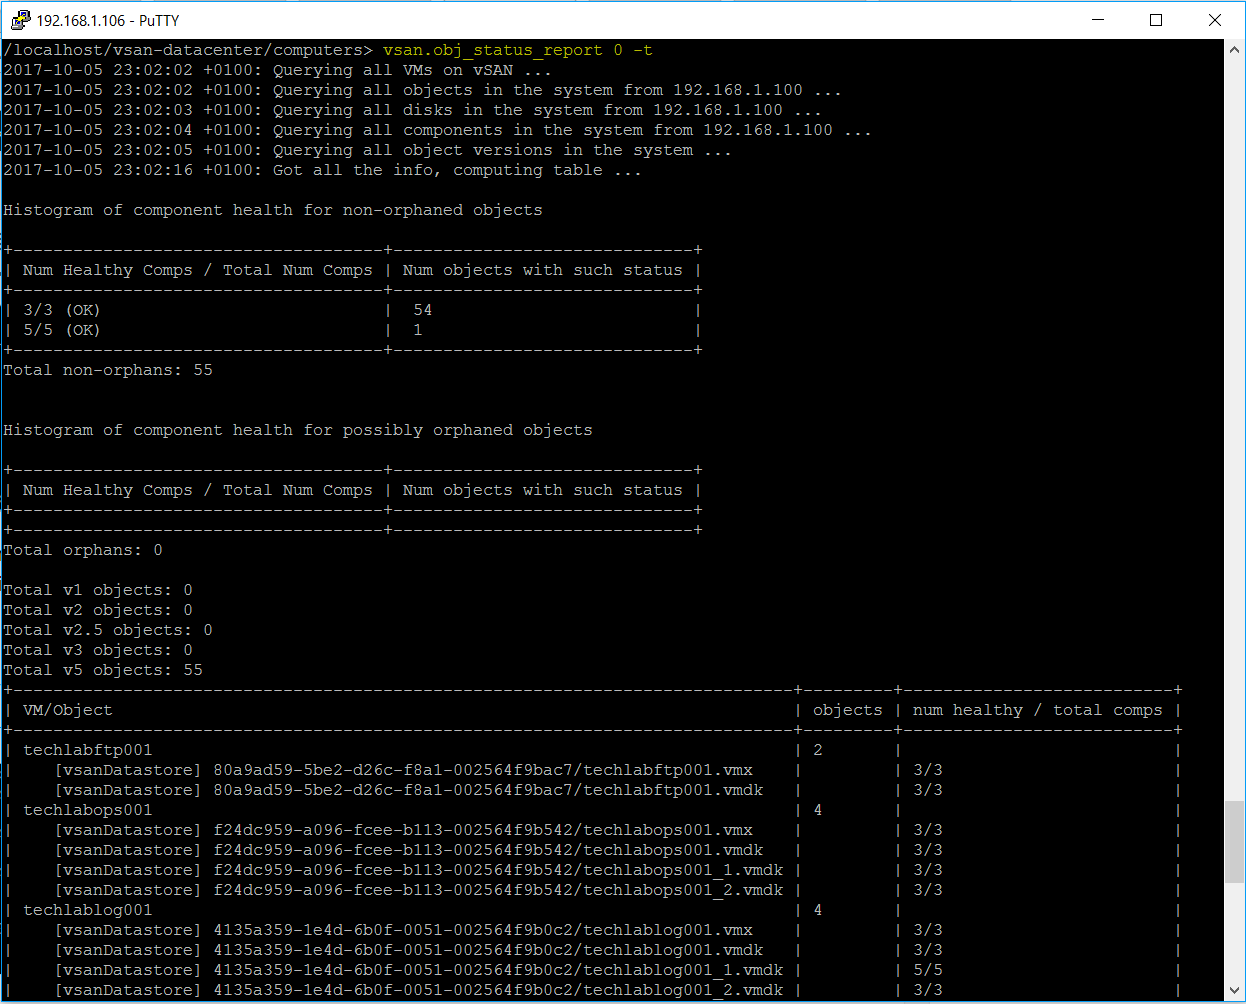
We can also run the command vsan.obj_status_report 0 -t which displays a table with more information about vSAN objects
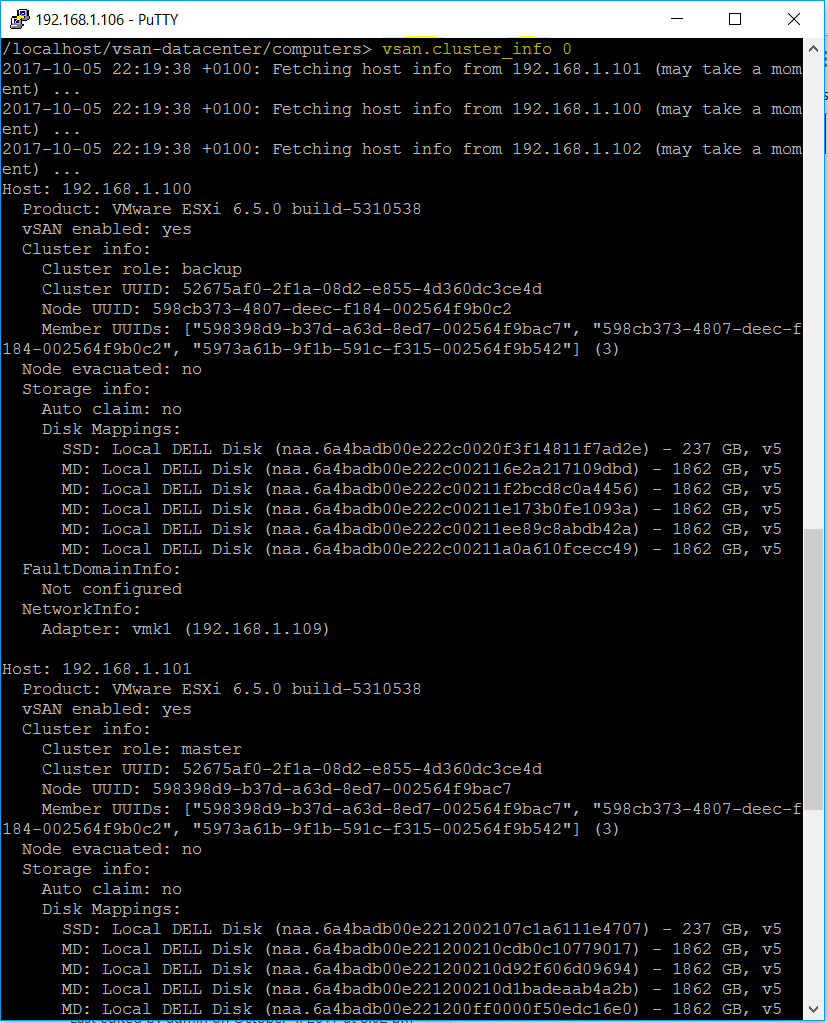
Next look at a detailed view of the cluster. Type vsan.cluster_info 0
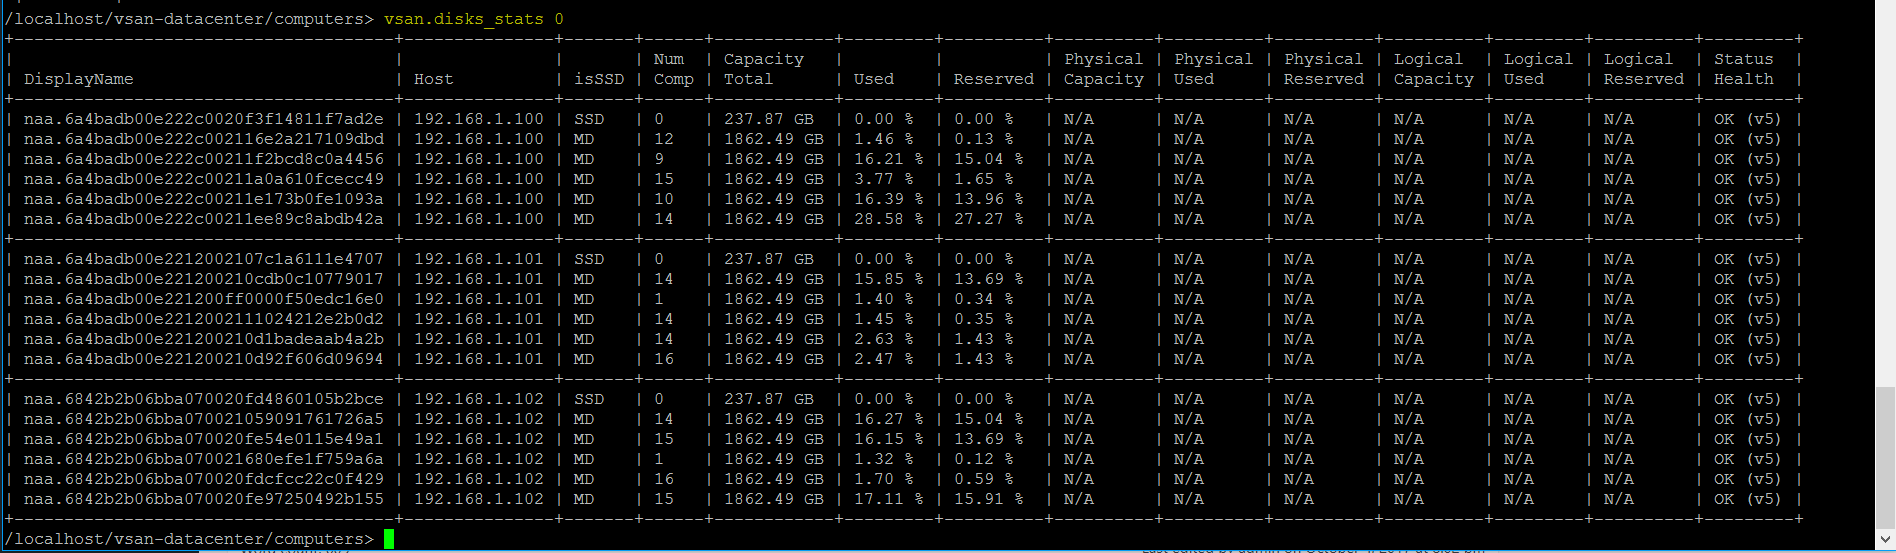
Next we’ll have a look at disk stats. Type vsan.disks_stats 0
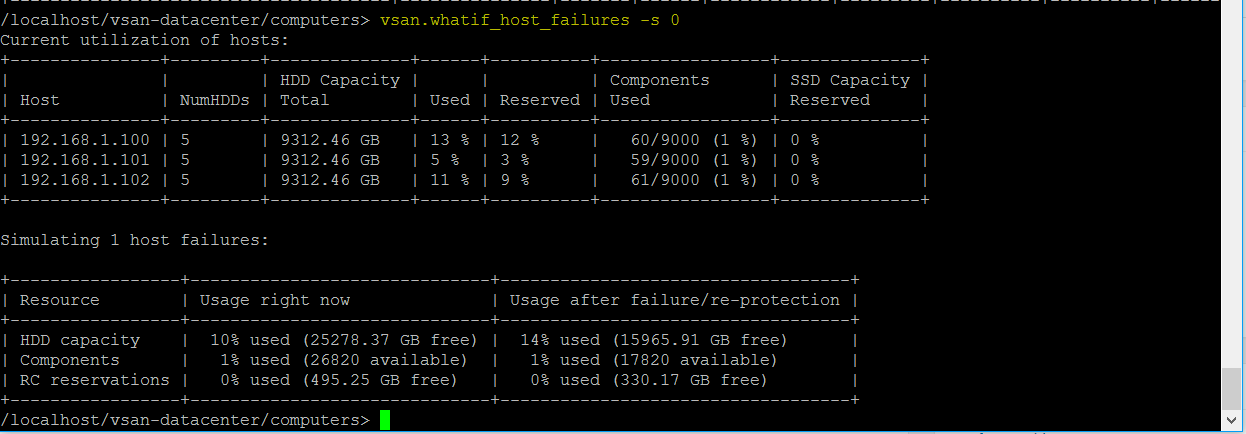
Next have a look at simulating a failure of a host on your vSAN cluster. type vsan.whatif_host_failures 0
You can also type vsan.whatif_host_failures -s 0
You can also view VM performance by typing vsan.vm_perf_stats “vm” This command will sample disk performance over a period of 20 seconds. This command will provide you with ‘read/write’ information IOPS, throughput and latency
To generate a performance statistics bundle over a one hour period at 30 second intervals for a vSAN cluster named vSAN and save the generated statistics bundle to the /tmp folder, run this command:
Log into rvc
Navigate down to Computers
Type the following vsan.observer ~/computers/clustername(fill this in)/ –run-webserver –force –generate-html-bundle /tmp –interval 30 –max-runtime 1
While this is running, you can log into a web browser and run http://vCentername:8010 which will provide multiple graphs and information you can view
Press Control C to stop if you want to stop this prior to the test ending.
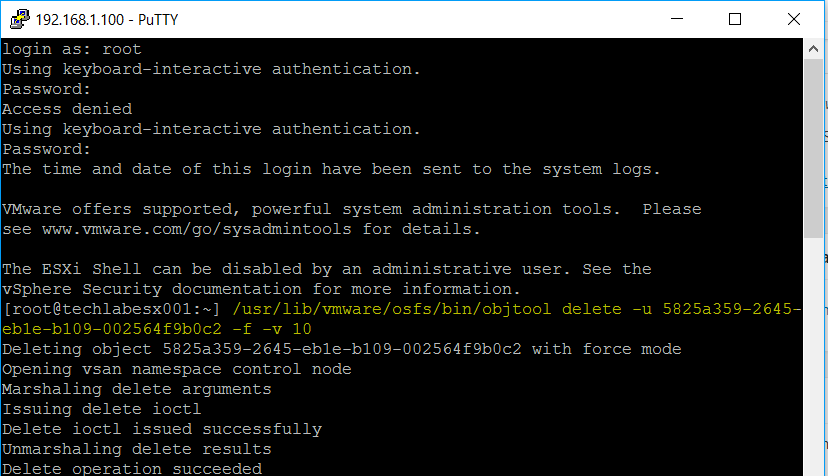
Inaccessible objects or orphaned objects
If you get an issue like I did with an orphaned object then browse through the vSAN datastore in the Web Client and find the GUID of the object and run the following command on the hosts. Take care you have the correct GUID! The first command checks the GUID and the second command deletes the GUID.
*Note* HCIBench is now on v1.6.6 – Use this version.
VMware has a vSAN Stress and Load testing tool called HCIBench, which is provided via VMware’s fling capability. HCIbench can be run in versions 5.5 and upwards today as a replacement for the vSAN Proactive tests which are inbuilt into vSAN currently. I am running this against vSphere 6.5/vSAN 6.6 today. HCIBench provides more flexibility in defining a target performance profile as input and test results from HCIBench can be viewed in a web browser and saved to disk.
HCIBench will help simplify the stress testing task, as HCIBench asks you to specify your desired testing parameters (size of working set, IO profile, number of VMs and VMDKs, etc.) and then spawns multiple instances of Vdbench on multiple servers. If you don’t want to configure anything manually there is a button called Easyrun which will set everything for you. After the test run is done, it conveniently gathers all the results in one place for easy review and resets itself for the next test run.
HCIBench is not only a benchmark tool designed for vSAN, but also could be used to evaluate the performance of all kinds of Hyper-Converged Infrastructure Storage in vSphere environment.
Where can I can find HCI Bench?
There is a dedicated fling page which will provide access to HCIBench and its associated documentation. A zip file containing the Vdbench binaries from Oracle will also be required to be downloaded which can be done through the configuration page after the appliance is installed. You will need to register an account with Oracle to download this file but this doesn’t take long.
vSphere 5.5 and later environments for both HCIBench and its client VMs deployment
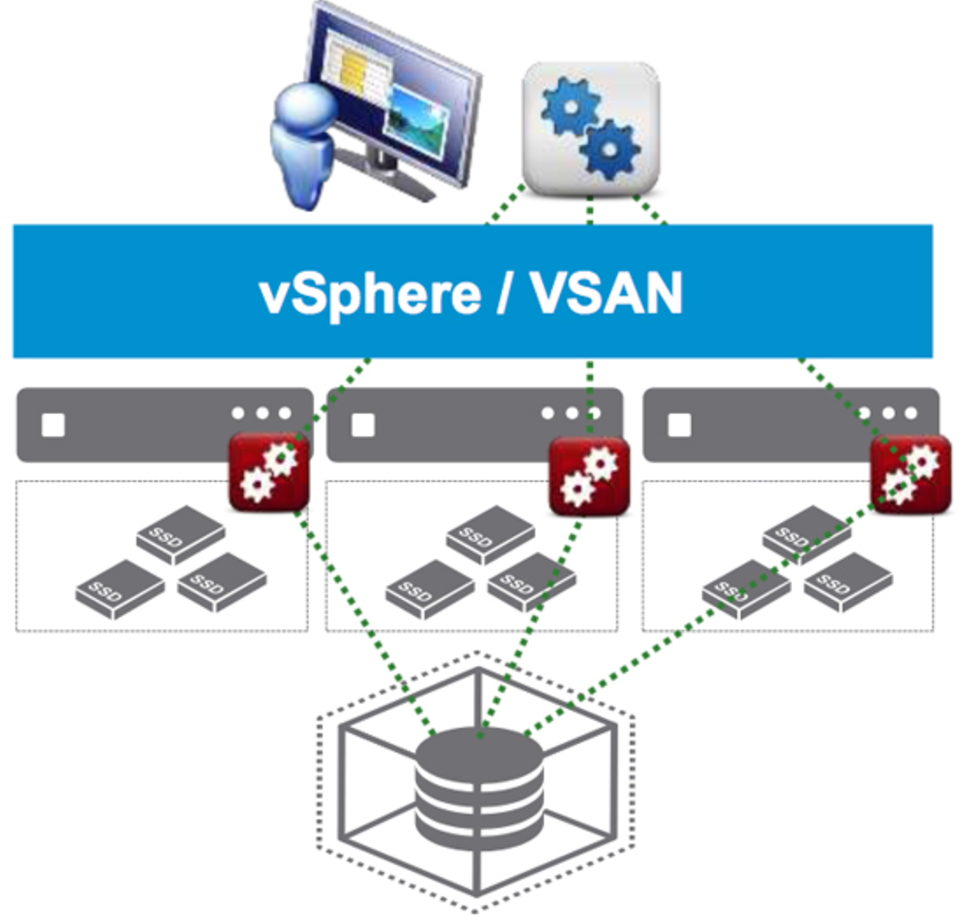
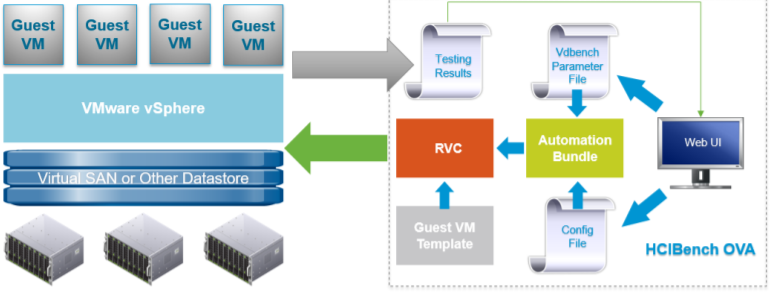
HCIBench Tool Architecture
The tool is specifically designed for running performance tests using Vdbench against a vSAN datastore.
It is delivered in the form of Open Virtualization Appliance (OVA) that includes the following components:
The test Controller VM is installed with:
Ruby vSphere Console (RVC)
vSAN Observer
Automation bundle
Configuration files
Linux test VM template
The Controller VM has all the needed components installed. The core component is RVC (https://github.com/vmware/rvc) with some extended features enabled. RVC is the engine of this performance test tool, responsible for deploying Vdbench Guest VMs, conducting Vdbench runs, collecting results, and monitoring vSAN by using vSAN Observer.
VM Specification Controller VM
CPU: 8 vCPU
RAM: 4GB
OS VMDK: 16GB
Operating system: Photon OS 1.0
OS Credential: user is responsible for creating the root password when deploying the VM.
Before deploying this performance test tool packaged as OVA, make sure the environment meets the following requirements:
The vSAN Cluster is created and configured properly
The network for Vdbench Guest VMs is ready, and needs to have DHCP service enabled; if the network doesn’t have DHCP service, “Private Network” must be mapped to the same network when HCIBench being deployed.
The vSphere environment where the tool is deployed can access the vSAN Cluster environment to be tested
The tool can be deployed into any vSphere environment. However, we do not recommend deploying it into the vSAN Cluster that is tested to avoid unnecessary resource consumption by the tool.
What am I benchmarking?
This is my home lab which runs vSAN 6.6 on 3 x Dell Poweredge T710 servers each with
Because the vApp option is used for deployment, HCIBench doesn’t support deployment on a standalone ESXi host, the ESXi host needs to be managed by a vCenter server.
When configuring the network, if you don’t have DHCP service on the VLAN that the VDBench client VMs will be deployed on, the “Private Network” needs to be mapped to the same VLAN because HCIBench will be able to provide the DHCP service.
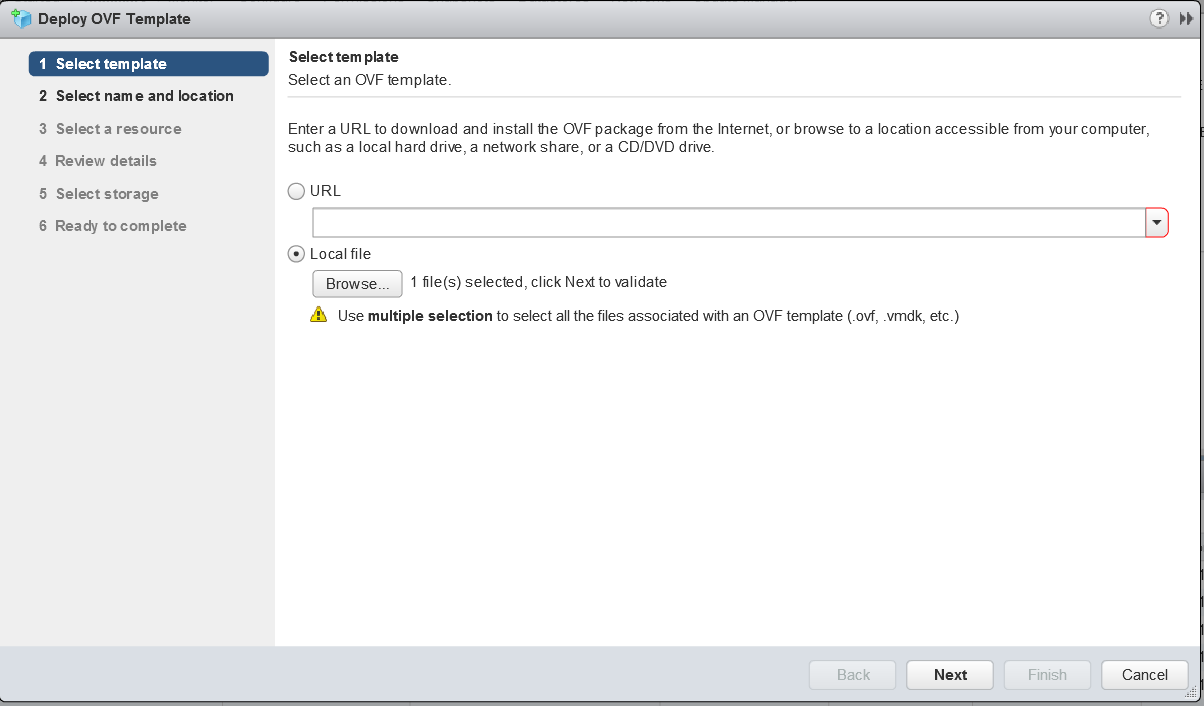
Log into vCenter and go to File > Deploy OVF File
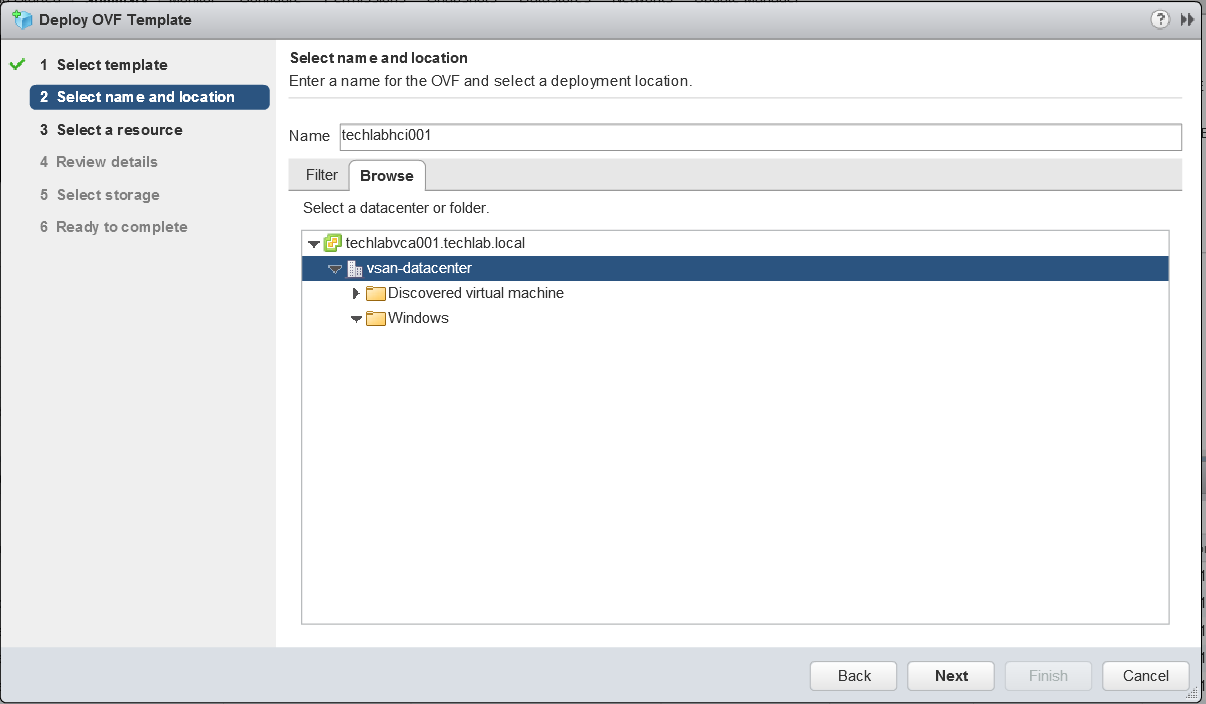
Name the machine and select a deployment location
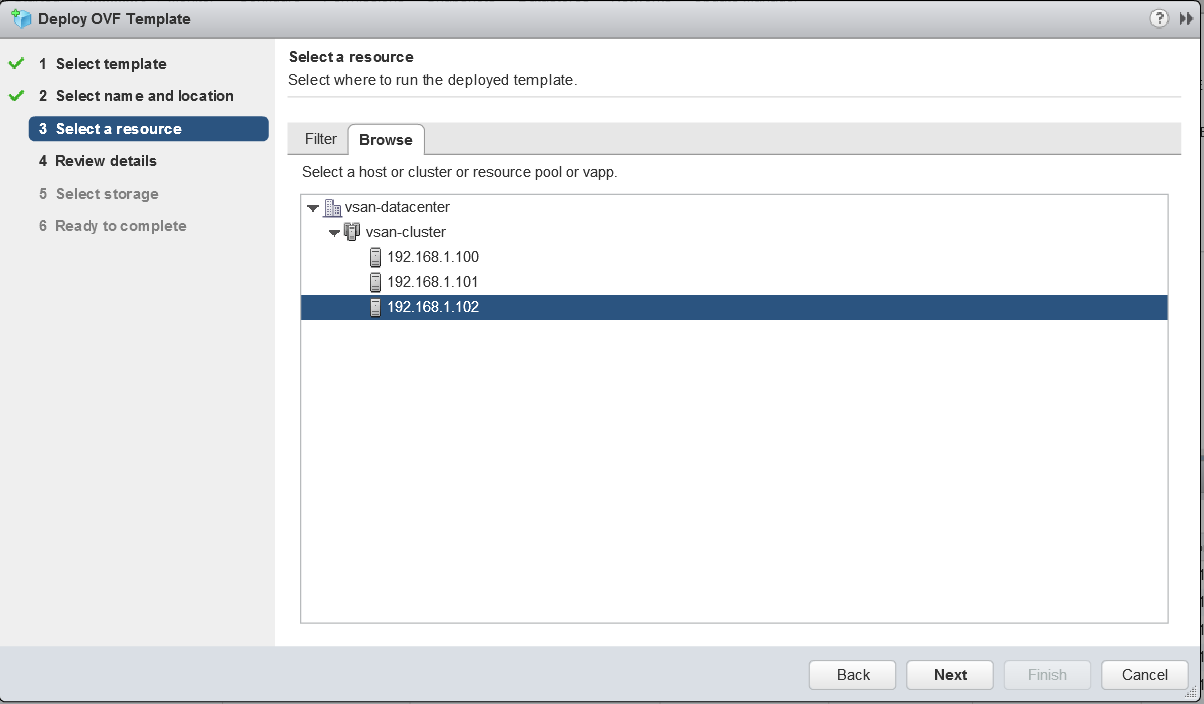
Select where to run the deployed template. I’m going to run it on one of my host local datastores as it is recommended to run it in a location other than the vSAN.
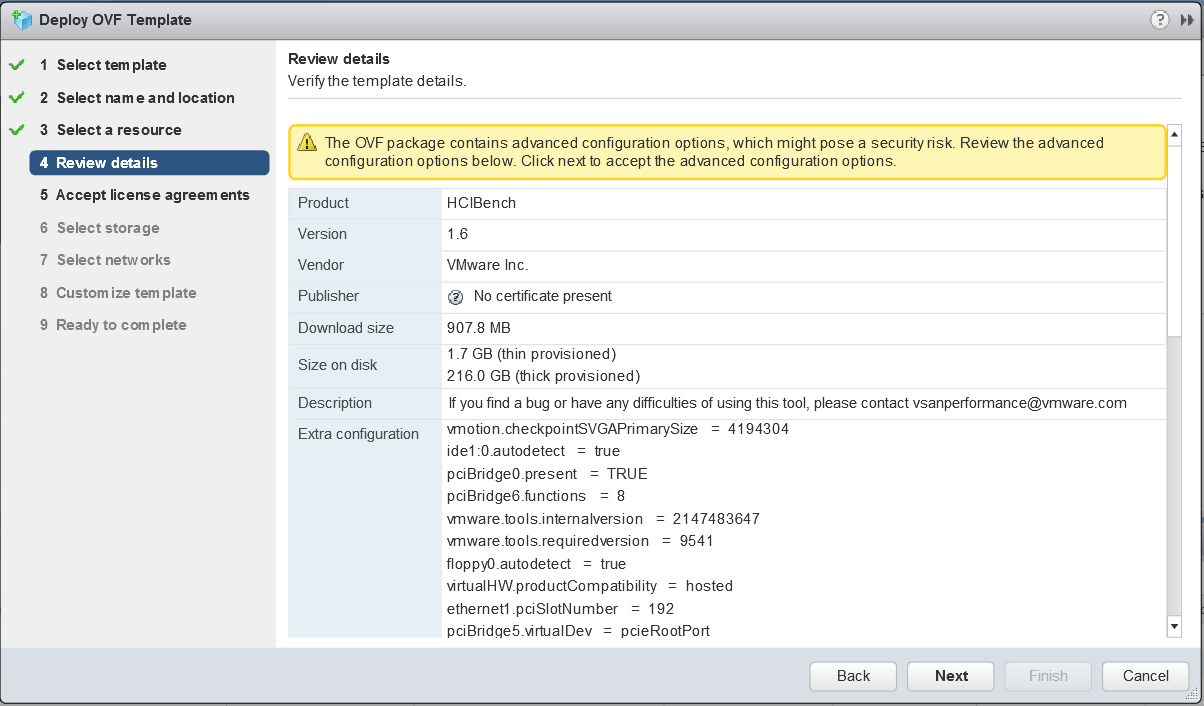
Review the details
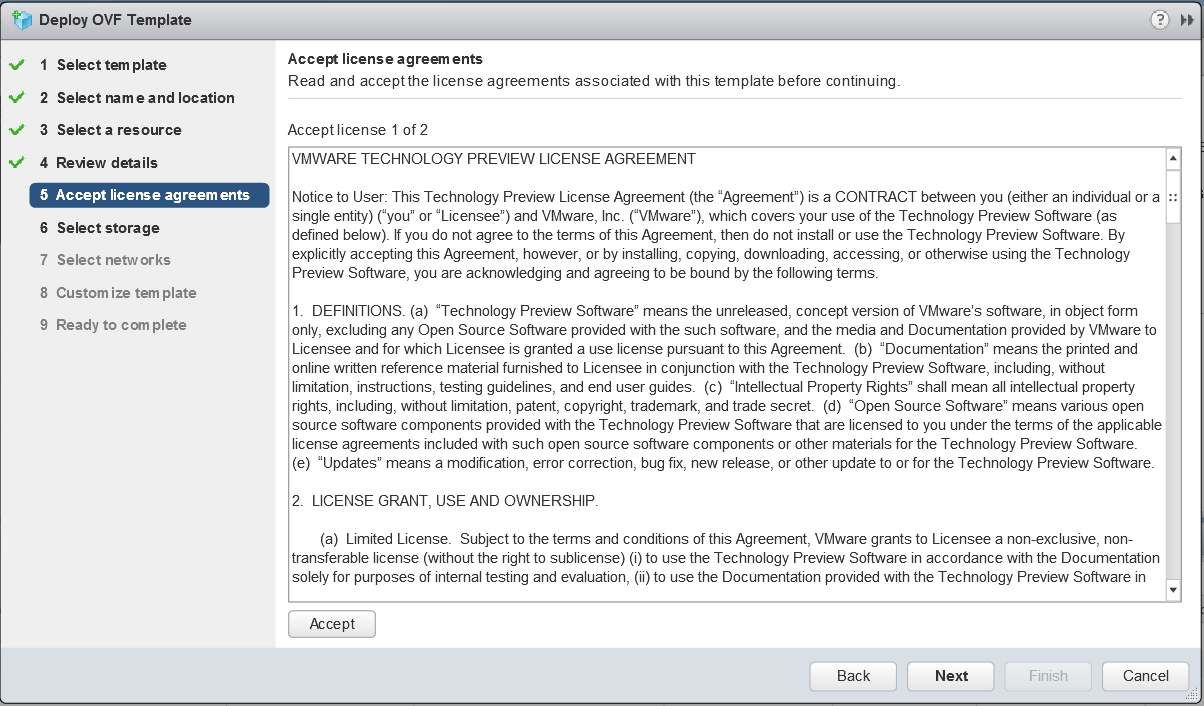
Accept the License Agreement
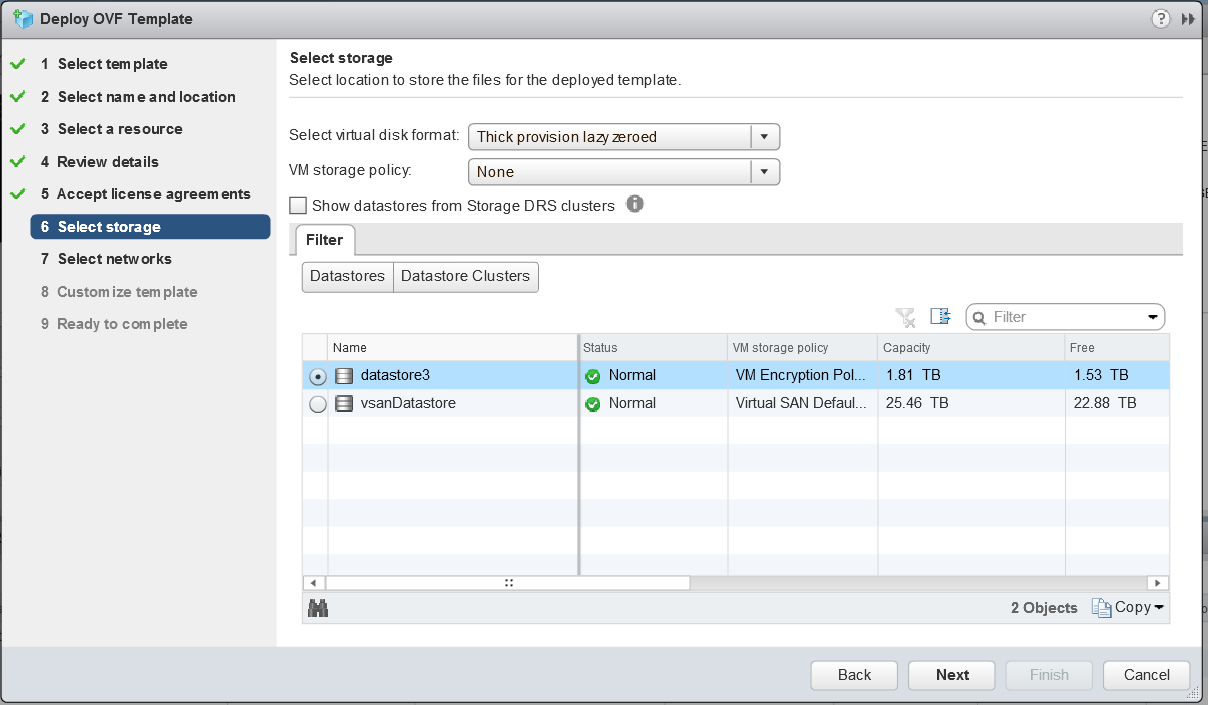
Select a storage location to store the files for the deployed template
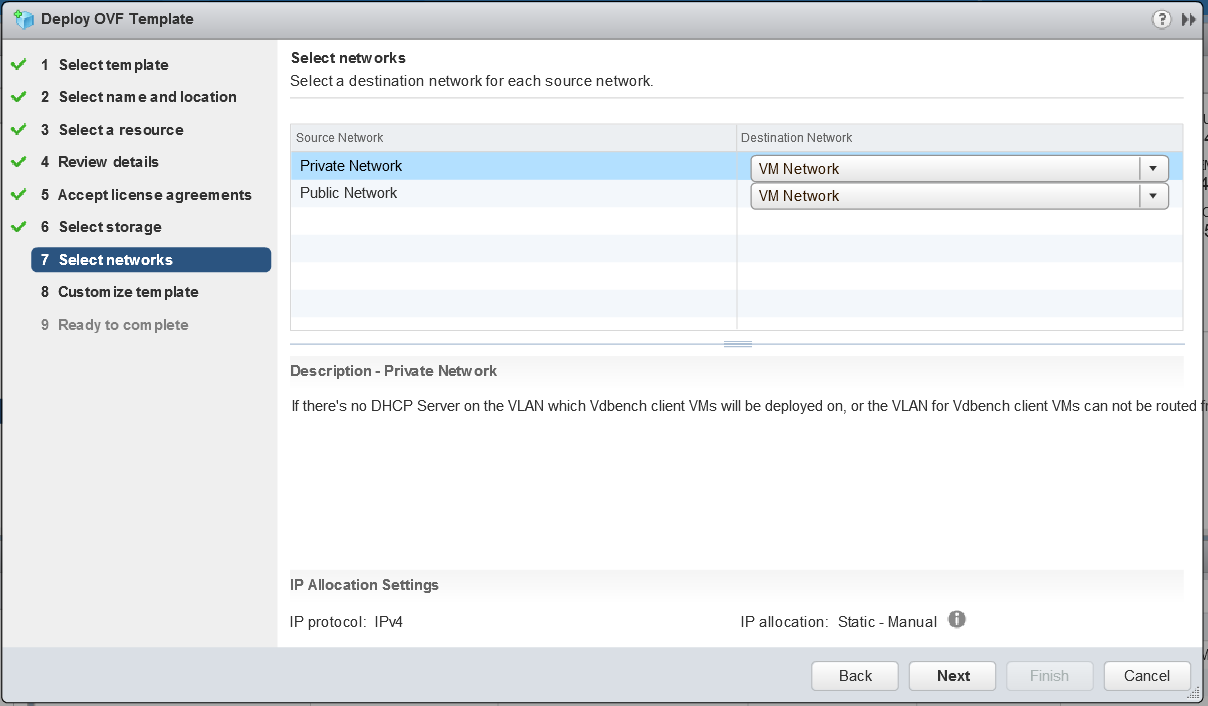
Select a destination network for each source network
Map the “Public Network” to the network which the HCIBench will be
accessed through; if the network prepared for Vdbench Guest VM doesn’t have DHCP service, map the “Private Network” to the same network, otherwise just ignore the “Private Network”.
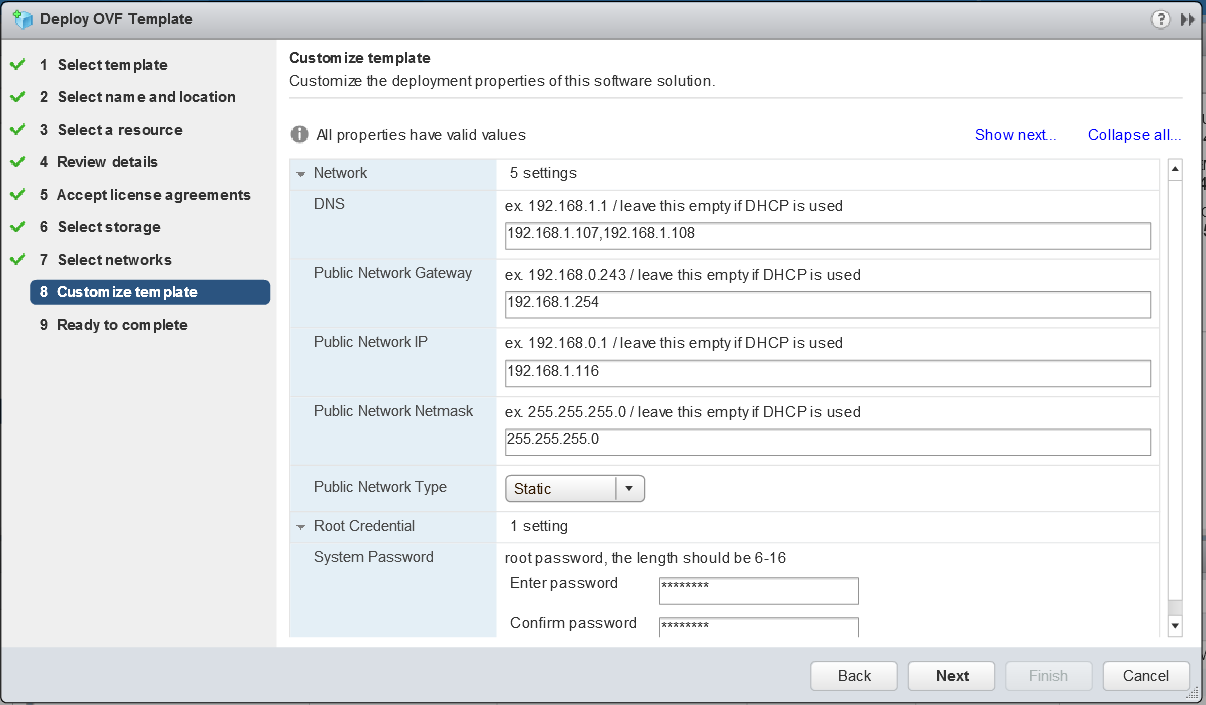
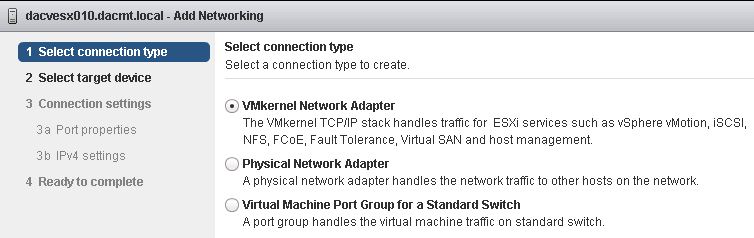
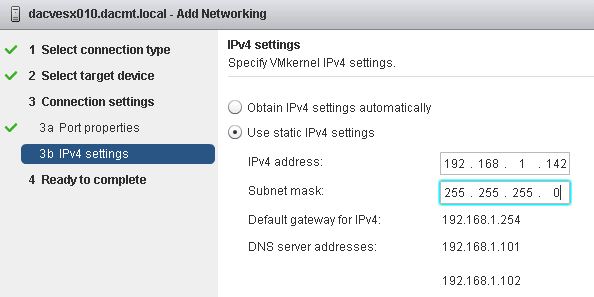
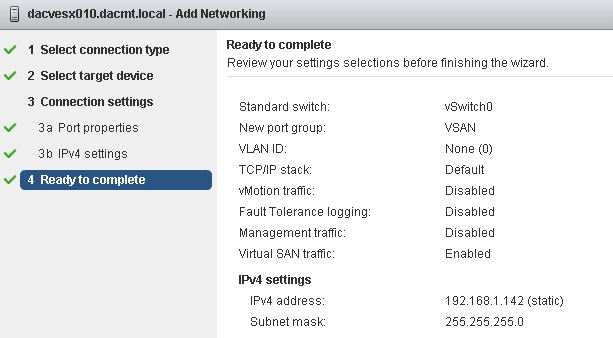
Enter the network details. I have chosen static and filled in the detail as per below. I have a Windows DHCP Server on my network which will issue IP Addresses to the worker VMs.
Note: I added the IP Address of the HCIBench appliance into my DNS Server
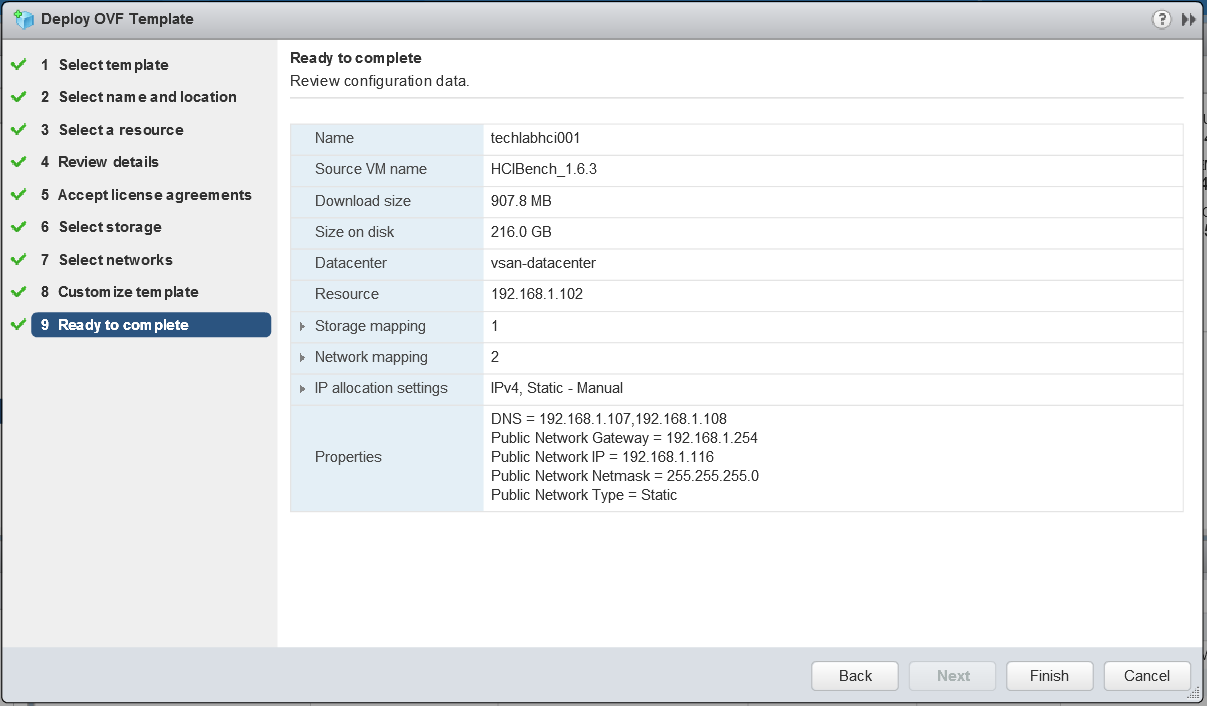
Click Next and check all the details
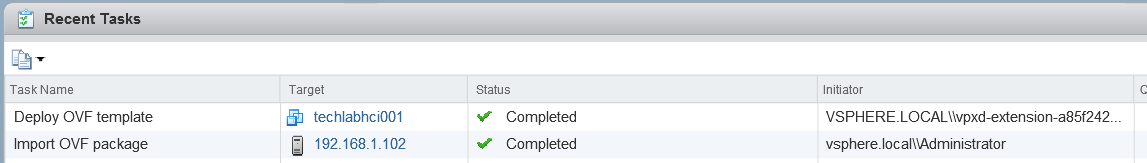
The OVF should deploy. If you get a failure with the message. “The OVF failed to deploy. The ovf descriptor is not available” then redownload the OVA and try again and it should work.
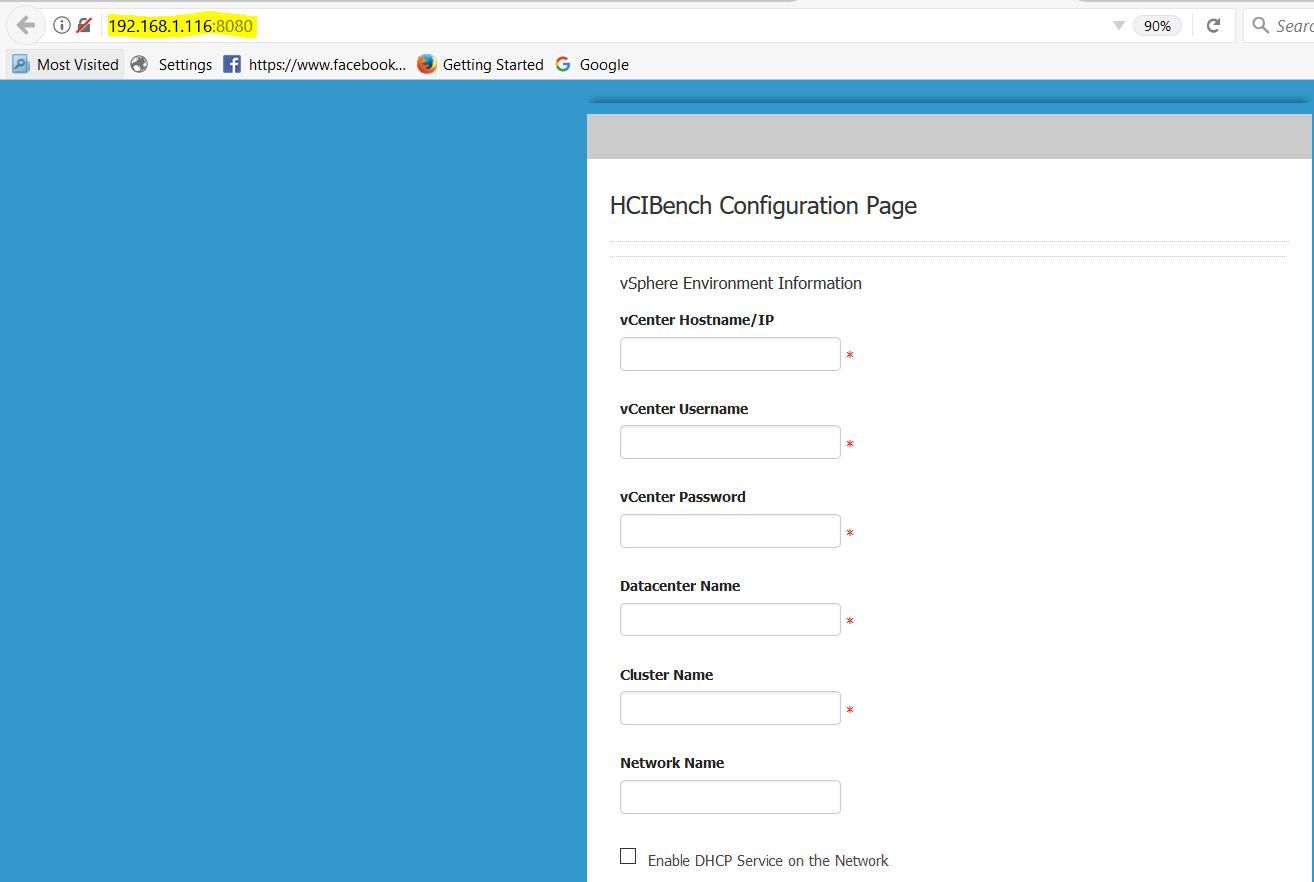
Next power on the Controller VM and go to your web browser and navigate to your VM using http://<Your_HCIBench_IP>:8080. In my case http://192.168.1.116:8080. Your IP is the IP address you gave it during the OVF deployment or the DHCP address it picked up if you chose this option. If it asks you for a root password, it is normally what you set in the Deploy OVF wizard.
Log in with the root account details you set and you’ll get the Configuration UI
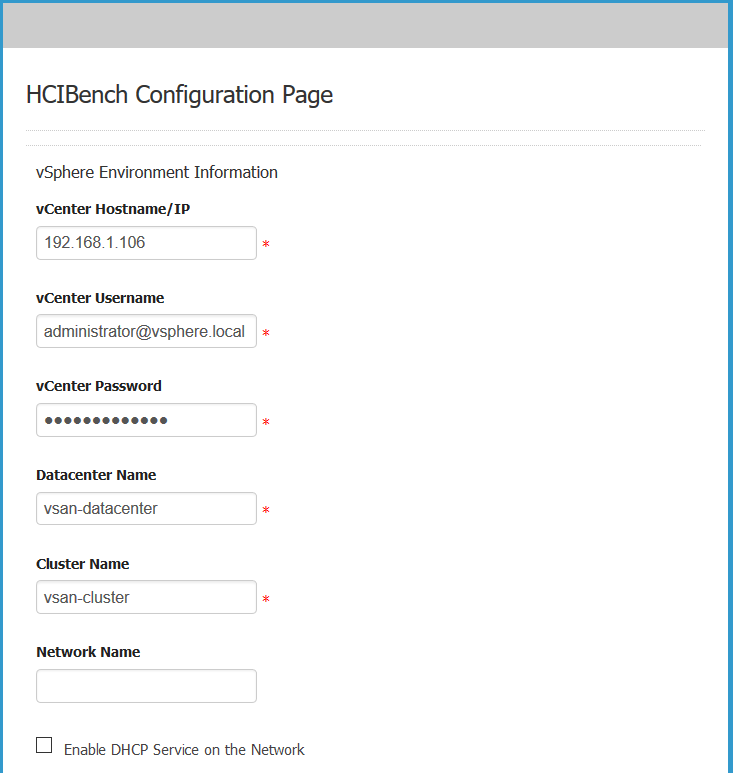
Go down the whole list and fill in each field. The screen-print shows half the configuration
Fill in the vCenter IP or FQDN
Fill in the vCenter Username as username@domain format
Fill in the Center Password
Fill in your Datacenter Name
Fill in your Cluster Name
Fill in the network name. If you don’t fill anything in here, it will assume the “VM Network” Note: This is my default network so I left it blank.
You’ll see a checkbox for enabling DHCP Service on the network. DHCP is required for all the Vdbench worker VMs that HCIBench will produce so if you don’t have DHCP on this network, you will need to check this box so it will assign addresses for you. As before I have a Windows DHCP server on my network so I won’t check this.
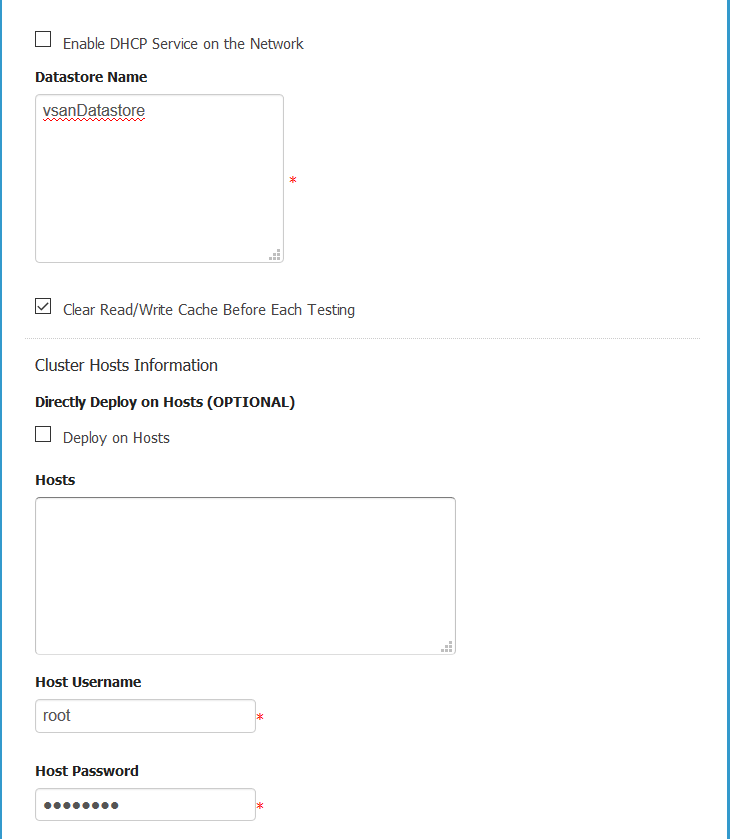
Next enter the Datastore name of the datastore you want HCIBench to test so for example I am going to put in vsanDatastore which is the name of my vSAN.
Select Clear Read/Write Cache Before Each Testing which will make sure that test results are not skewed by any data lurking in the cache. It is designed to flush the cache tier prior to testing.
Next you have the option to deploy the worker VMs directly to the hosts or whether HCIBench should leverage vCenter
If this parameter is unchecked, ignore the Hosts field below, for the Host Username/Password fields can also be ignored if Clear Read/Write Cache Before Each Testing is unchecked. In this mode, a Vdbench Guest VM is deployed by the vCenter and then is cloned to all hosts in the vSAN Cluster in a round-robin fashion. The naming convention of Vdbench Guest VMs deployed in this mode is
“vdbench-vc-<DATASTORE_NAME>-<#>”.
If this parameter is checked, all the other parameters except EASY RUN must be specified properly.
The Hosts parameter specifies IP addresses or FQDNs of hosts in the vSAN Cluster to have Vdbench Guest VMs deployed, and all these hosts should have the same username and password specifed in Host Username and Host Password. In this mode, Vdbench Guest VMs are deployed directly on the specified hosts concurrently. To reduce the network traffic, five hosts are running deployment at the same time then it moves to the next five hosts. Each host also deploys at an increment of five VMs at a time.
The naming convention of test VMs deployed in this mode is “vdbench-<HOSTNAME/IP>-<DATASTORE_NAME>-batch<VM#>-<VM#>”.
In general, it is recommended to check Deploy on Hosts for deployment of a large number of testVMs. However, if distributed switch portgroup is used as the client VM network, Deploy on Hosts must be unchecked.
EASY RUN is specifically designed for vSAN user, by checking this, HCIBench is able to handle all the configurations below by identifying the vSAN configuration. EASY RUN helps to decide how many client VMs should be deployed, the number and size of VMDKs of each VM, the way of preparing virtual disks before testing etc. The configurations below will be hidden if this option is checked.
You can omit all the host details and just click EASYRUN
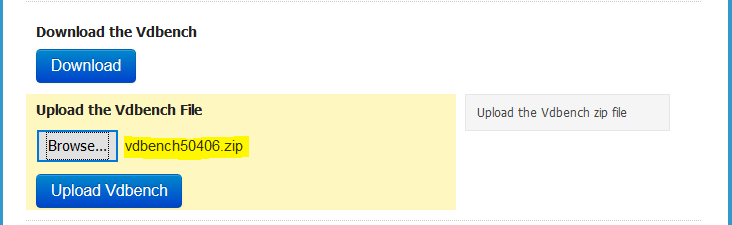
Next Download the vDBench zip file and upload it as it is. Note: you will need to create yourself an Oracle account if you do not have one.
It should look like this. Click Upload
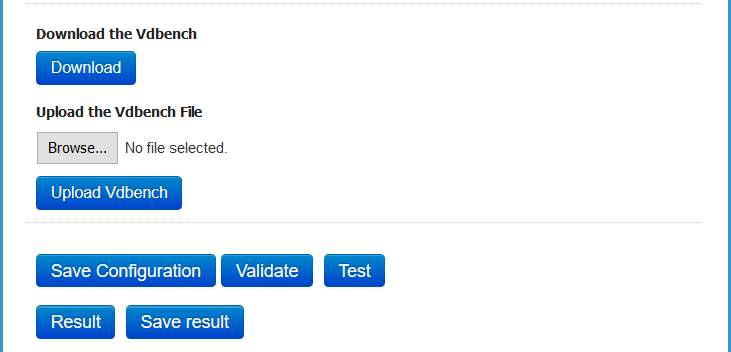
Click Save Configuration
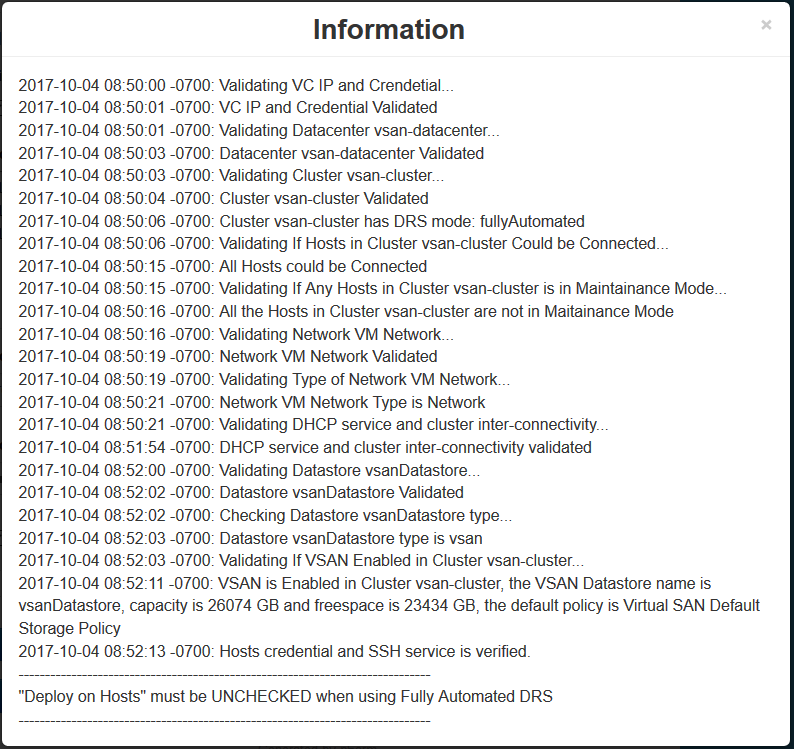
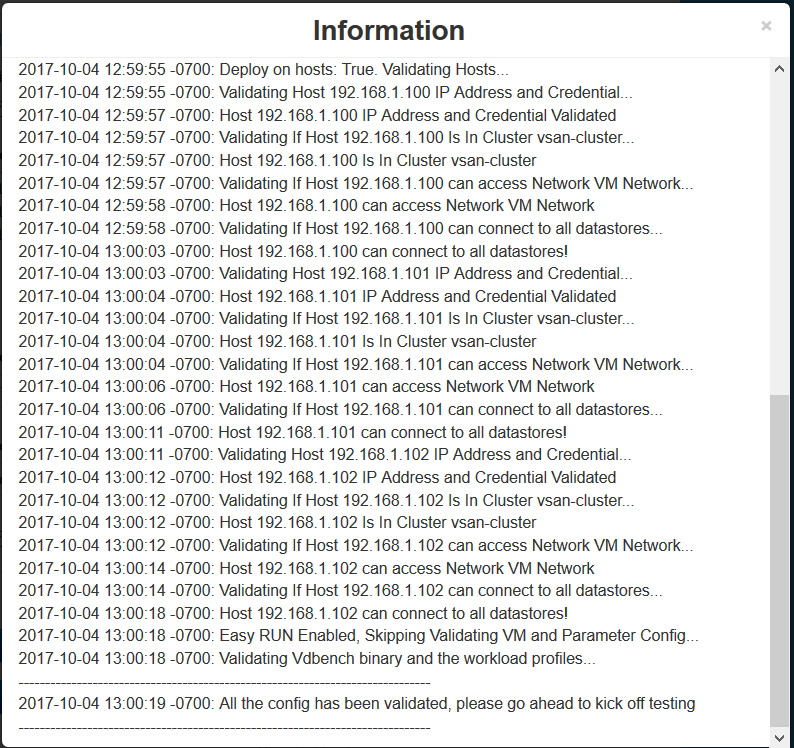
Click Validate the Configuration.Note at the bottom, it is saying to “Deploy on hosts must be unchecked” when using fully automated DRS. As a result I changed my cluster DRS settings to partially automated and then I got the correct message below when I validated again.
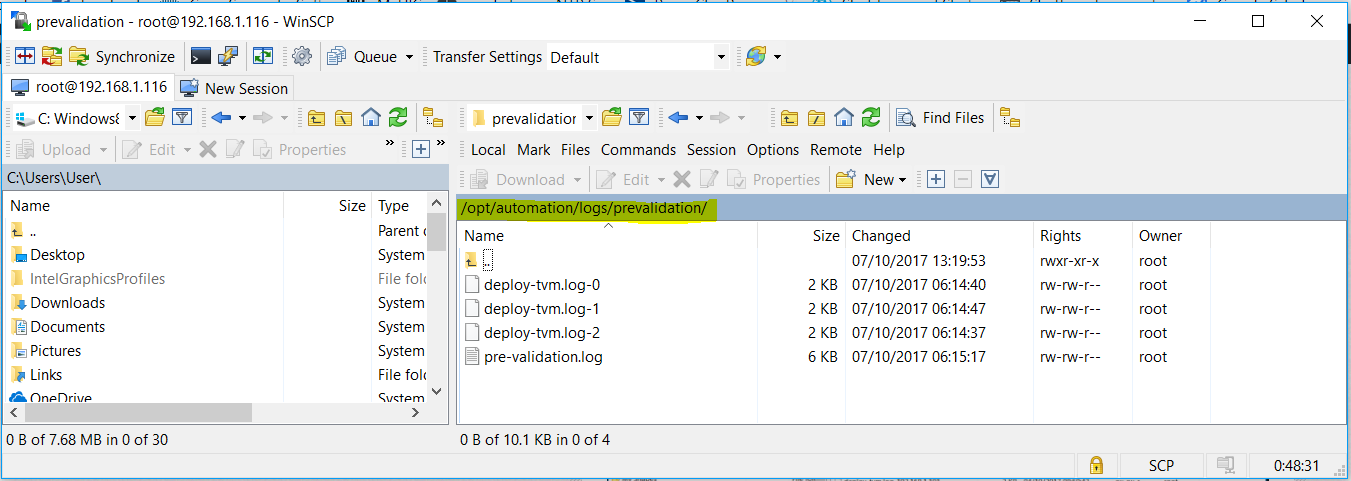
If you get any issues, please look at the Pre-validation logs located here – /opt/automation/logs/prevalidation
Next we can start a Test. Click Test
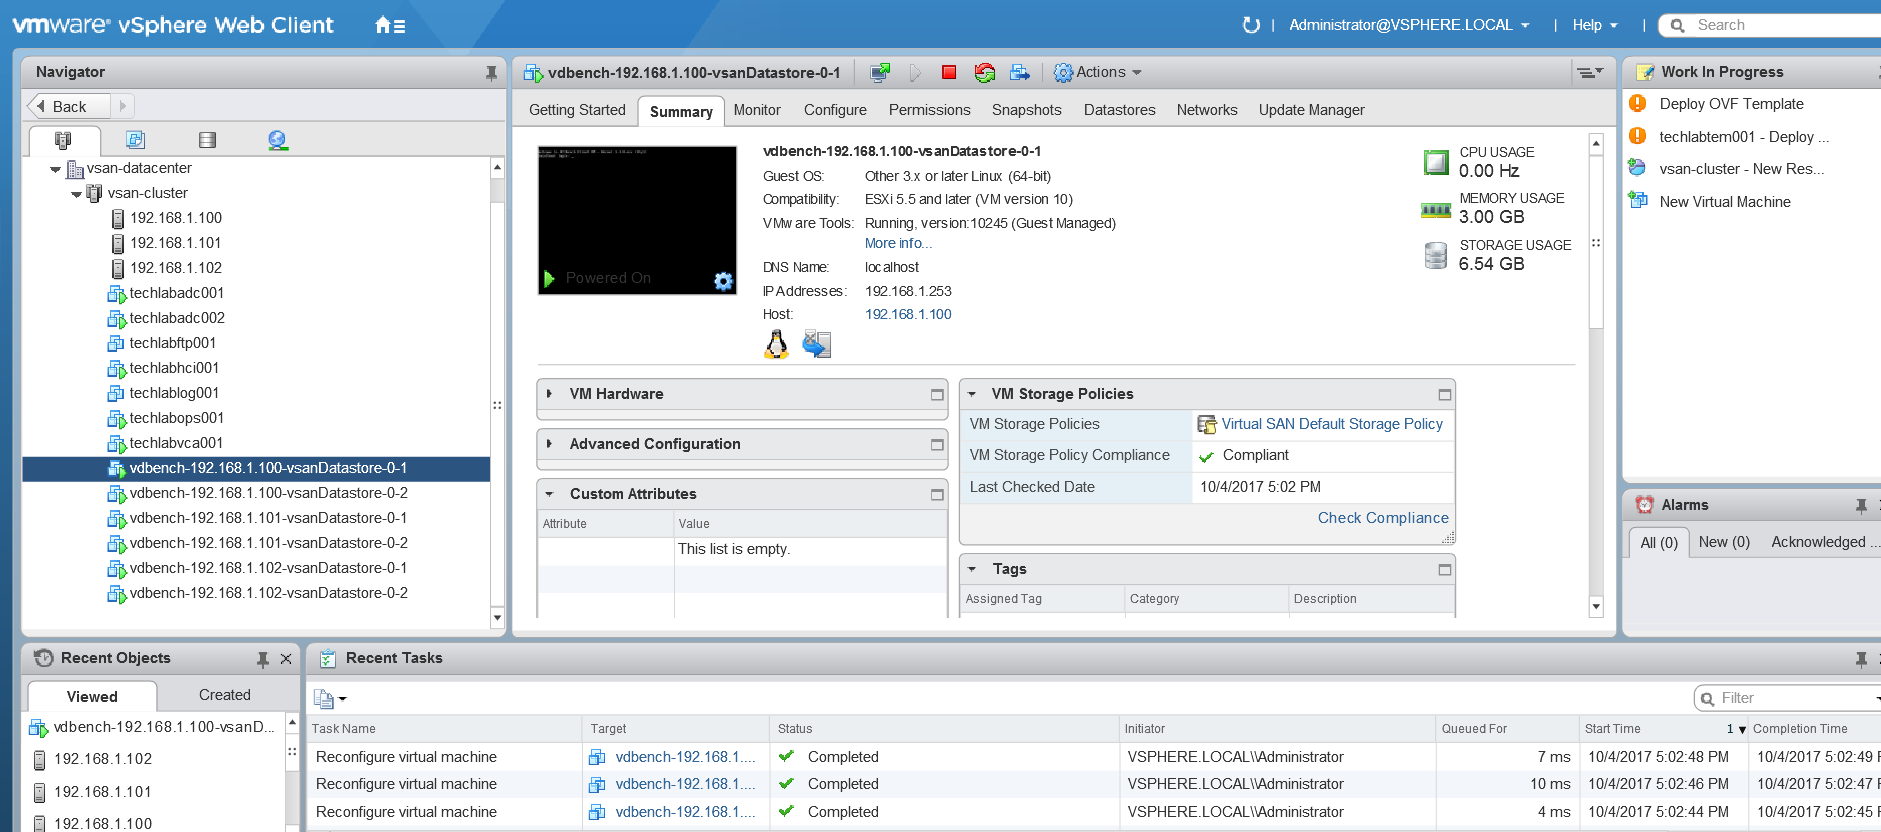
You will see the VMs being deployed in vCenter
And more messages being shown
It should finish and say Test is finished
Results
Just as a note after the first test, it is worth checking that the Vms are spread evenly across all the hosts you are testing!
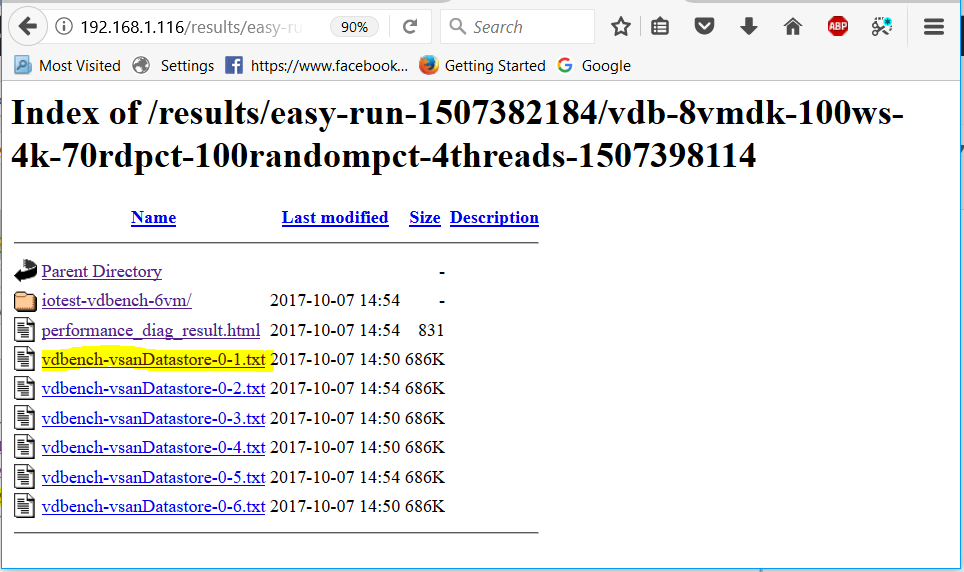
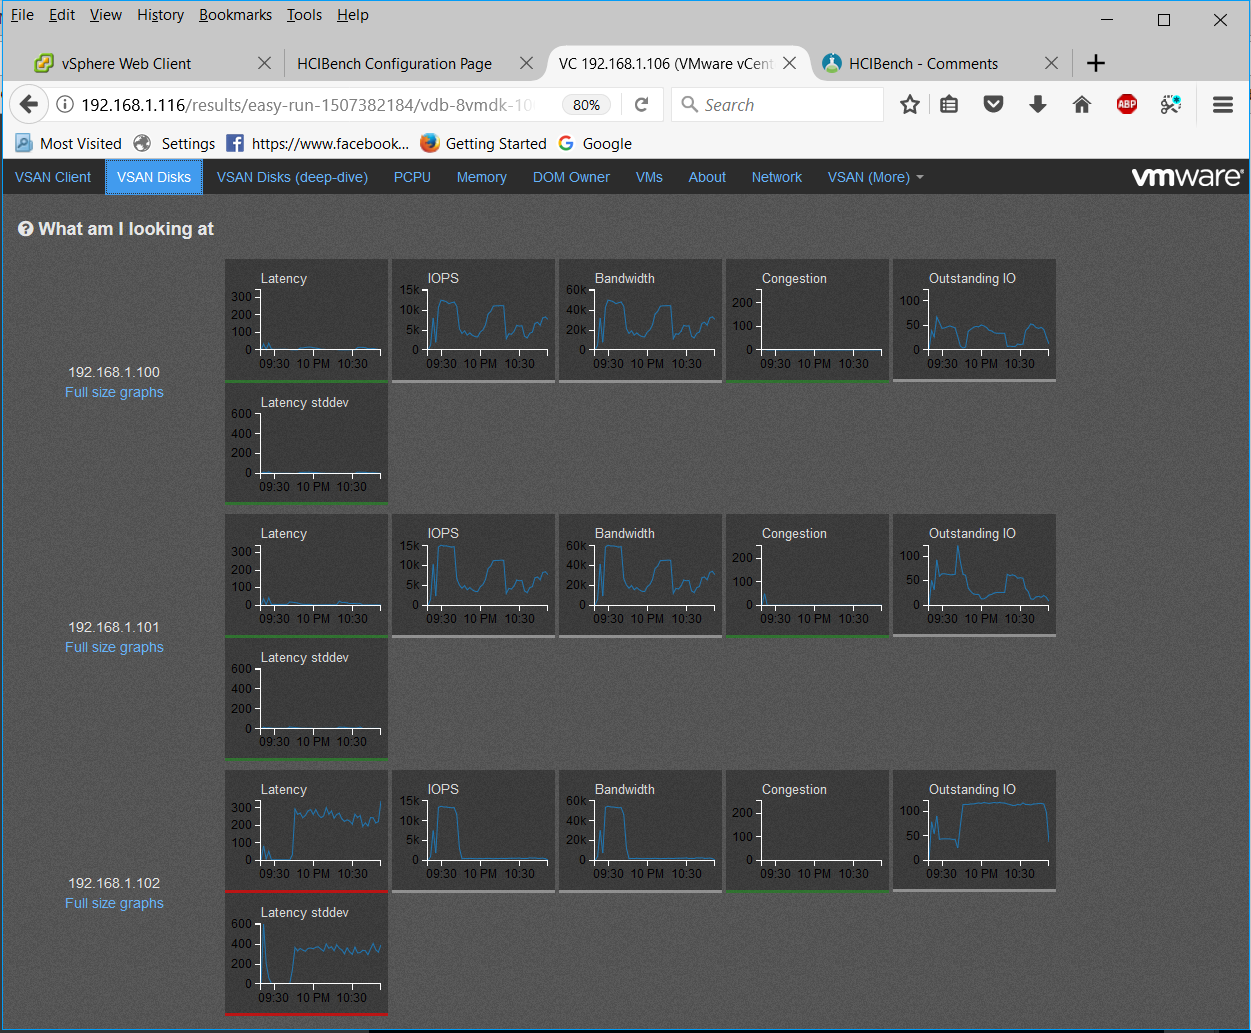
After the Vdbench testing finishes, the test results are collected from all Vdbench instances in the test VMs. And you can view the results at http://HCIBench_IP/results in a web browser and/or clicking the results button from the testing window.
You can also click Save Result and save a zip file of all the results
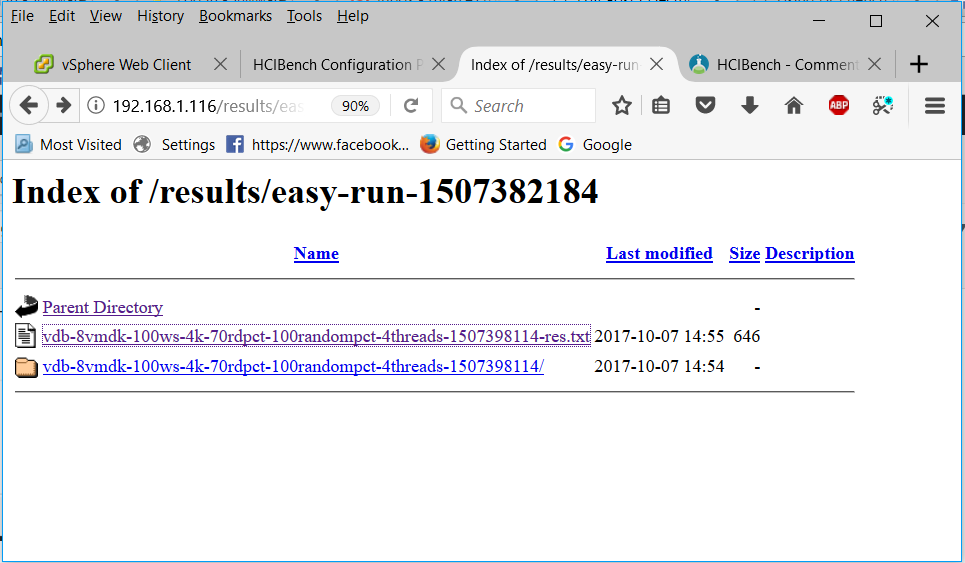
Click on the easy-run folder
Click on the .txt file
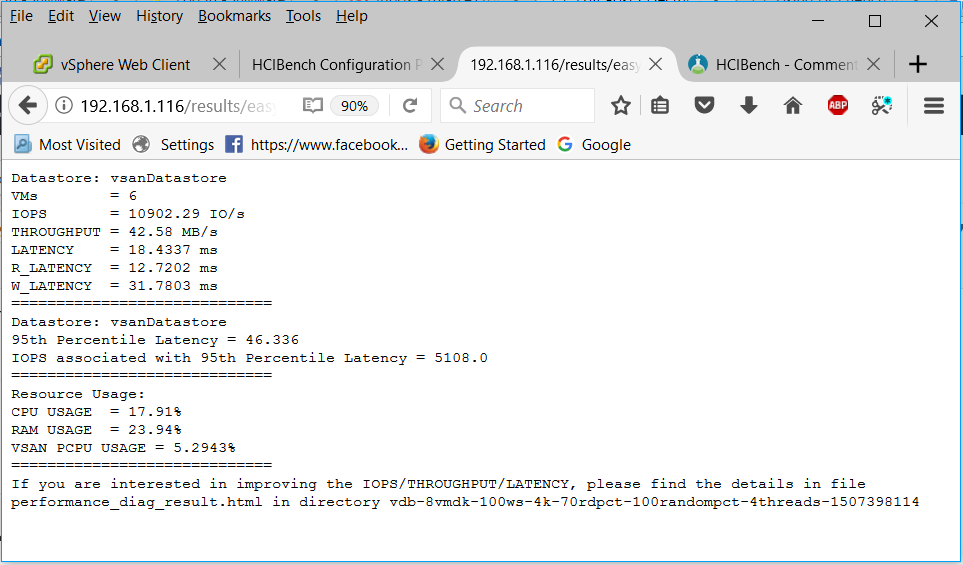
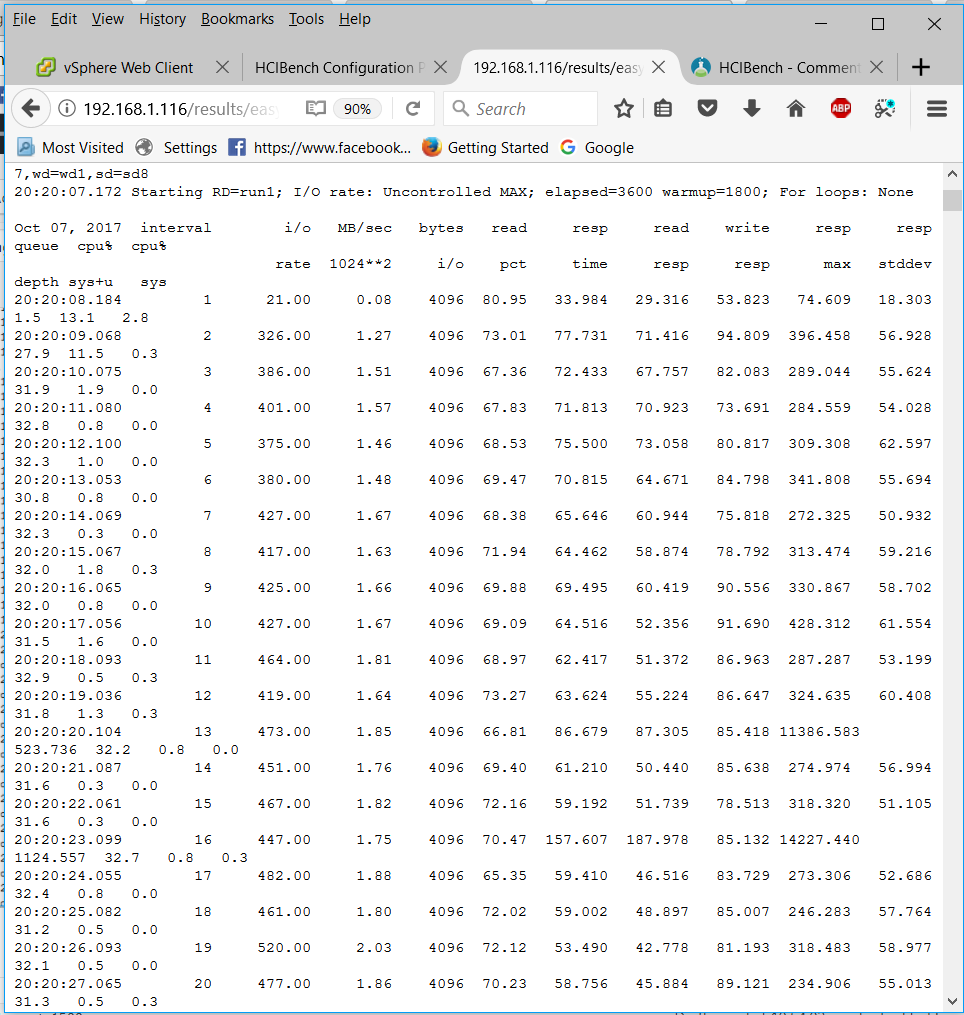
You will get a summarized results file
Just as a note in the output above, the 95th Percentile Latency can help the user to understand that during 95% of the testing time, the average latency is below 46.336ms
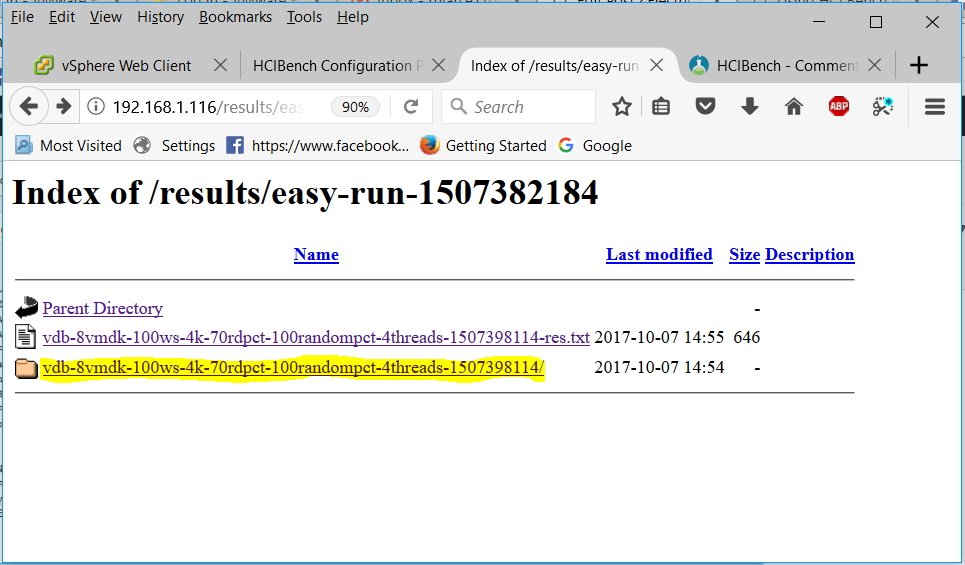
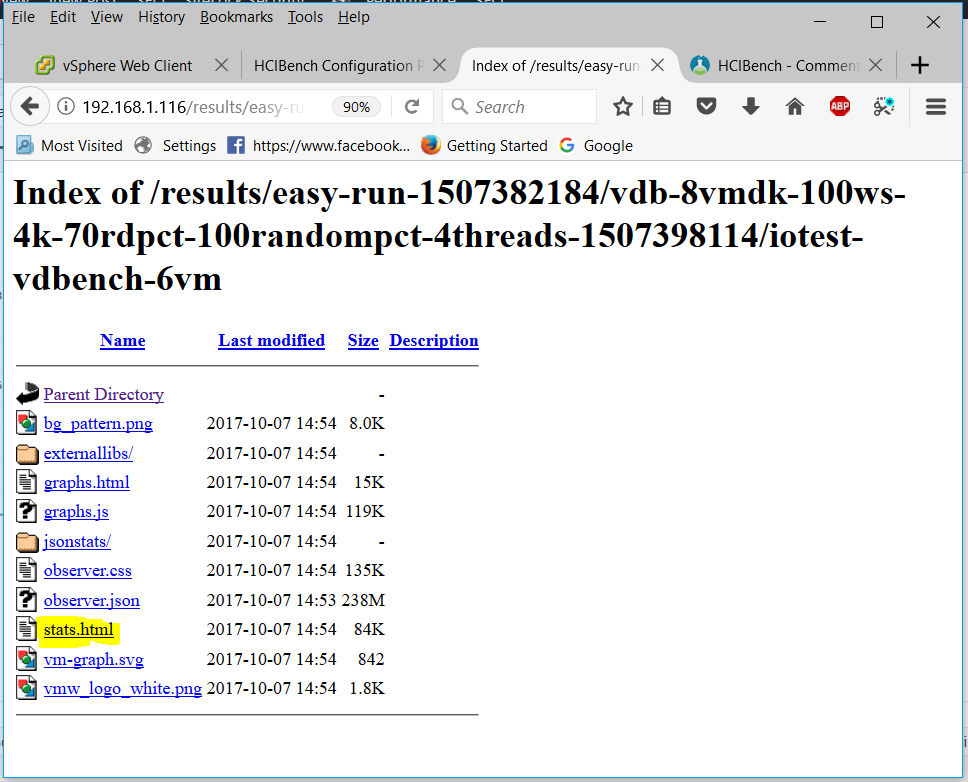
Click on the other folder
You can also see the individual vdBench VMs statistics by clicking on
You can also navigate down to what is a vSAN Observer collection. Click on the stats.html file to display a vSAN Observer view of the cluster for the period of time that the test was running
You will be able to click through the tabs to see what sort of performance, latency and throughput was occurring.
Enjoy and check you are getting the results you would expect from your storage
The results folder holds 200GB results so you may need to delete some results if it gets full. Putty into the appliance, go to /opt/output/results and you can use rm -Rf “filename”
Useful Links
Comments from the HCIBench fling site which may be useful for troubleshooting
This is a blog based on my Dell Poweredge T710 lab which I’ve set up to take advantage of testing vSphere 6.5 and vSAN 6.6 as a combined install of a new installation which should bootstrap vSAN, create a vCenter and then place the vCenter on the vSAN automatically.
Note: vSAN will be a hybrid configuration of 1 x SSD and 6 SATA hot plug drives per server.
New integrated bootstrapping feature explained
In some environments where new hardware being deployed, high availability shared storage may not be accessible during day-zero installation meaning if you were building a greenfield deployment, it was almost a catch 22 scenario. How did you build your vSAN with a vCenter server when you only had the disks for a vSAN deployment. There were ways around this via command line but it has now been built into the functionality of vSphere 6.5/vSAN 6.6.
Local disk, if available, can be used as a temporary location for vCenter installation, but vCenter migration after bringing up the cluster could be time consuming and error prone. Bootstrapping vSAN without vCenter can solve this problem and remove the requirement to have high availability storage or temporary local disk at day-zero operations. This could be applicable to a greenfield deployment scenario. With the Bootstrapping vSAN method, a vSAN based datastore can be made available at day-zero operation to bring-up all management components.
Lab Setup
3 x Dell Poweredge T710 servers each with
2 x 6 core X5650 2.66Ghz processors
128GB RAM
6 x Dell Enterprise 2TB SATA 7.2k hot plug drives
1 x Samsung 256GB SSD Enterprise 6.0Gbps
Perc 6i RAID BBWC battery-backed cache
iDRAC 6 Enterprise Remote Card
NetXtreme II 5709c Gigabit Ethernet NIC
Initial Steps for each 3 hosts
The Perc 6i controller is not on the vSAN HCL but vSAN can still be setup using RAID0 passthrough which involves configuring a RAID0 volume for each drive in the BIOS (Ctrl + R at bootup) Always make sure the drive is initialized in the BIOS which clears any previous content because vSAN requires the drives to be empty. Press Control > R during boot up and access the Virtual Disk Management screen to create disks as RAID0. See the link below for full information
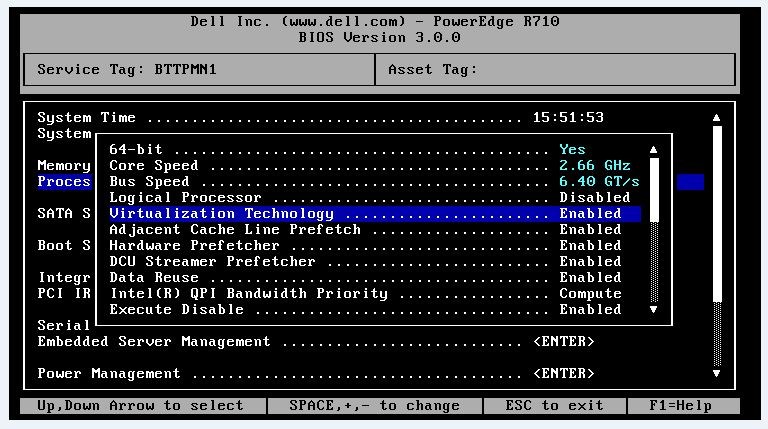
In the System Setup BIOS screen you will need to enable Virtualization Technology. Not enabled by default and will stop any VMs from powering on if not enabled
Make sure you have an AD/DNS Server with entries for your hosts and vCenter
Put in your license keys
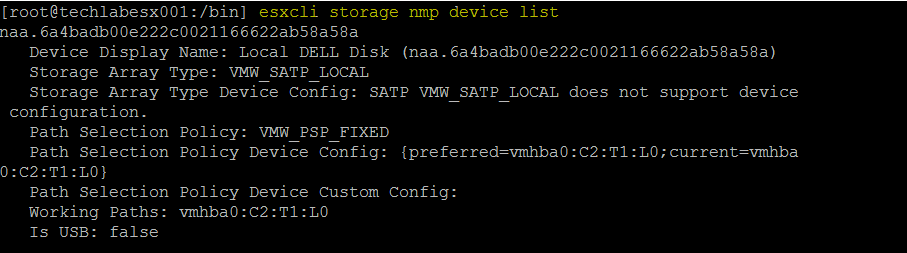
Disks may not come up marked as SSD. In this case I had to run the following commands on each server (Replace your disk naa id with yours and the SATP Type)
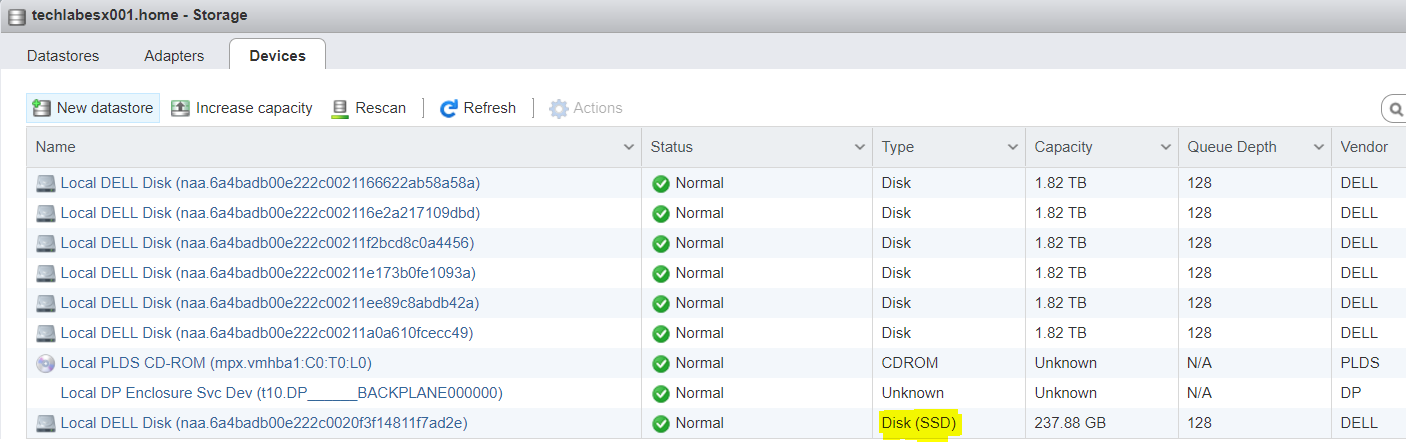
Find your disk information as per below command but you can also find the disk ID’s in the host client
Your SSD disks should then come up marked as SSD. I didn’t have to reboot.
Install the vCenter Appliance
Make sure you have the software downloaded. I’m using the VMware-VCSA-all-6.5.0-5705665.iso
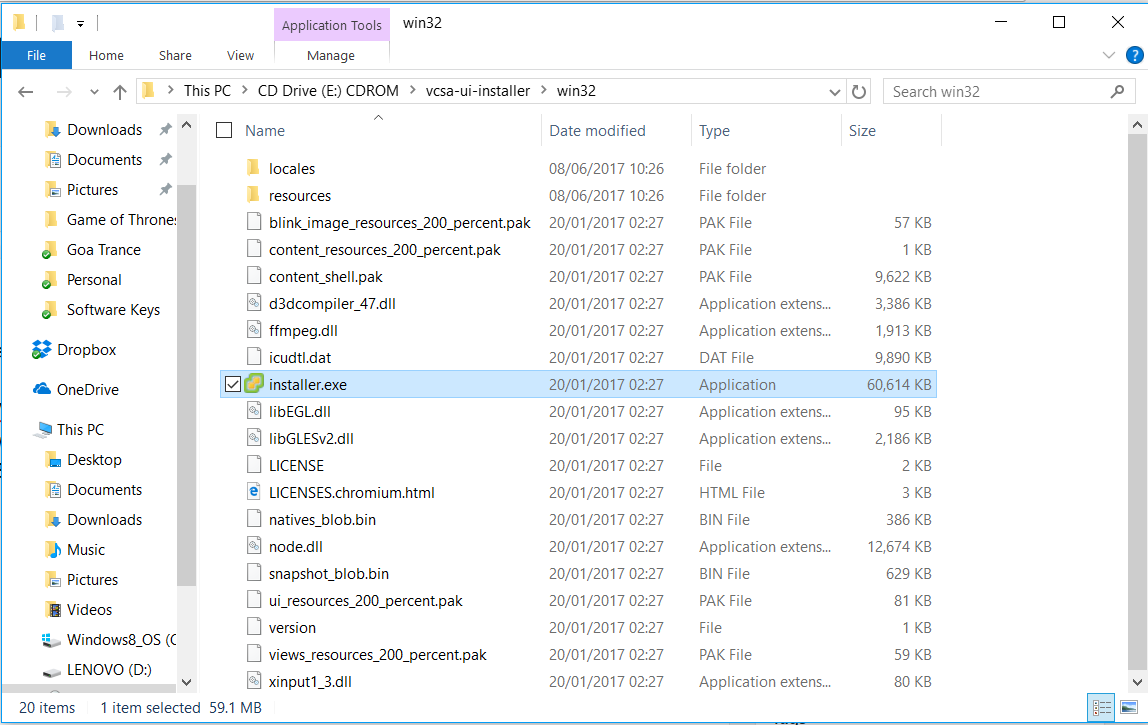
On another machine, mount the VMware-VCSA-all-6.5.0-5705665.iso. I connected this to my Windows 10 laptop as a virtual drive. Start the vCenter Server Appliance 6.5 installer located at \vcsa-ui-installer\win32
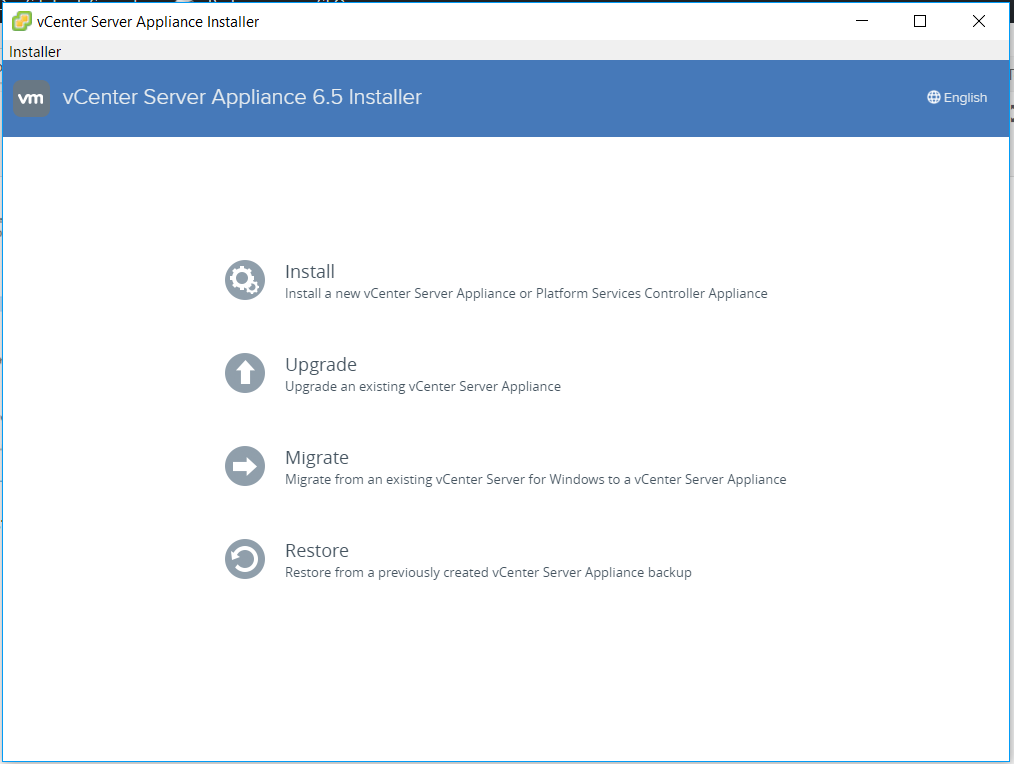
Select Install from the VMware vCenter Server Appliance 6.5 Installer.
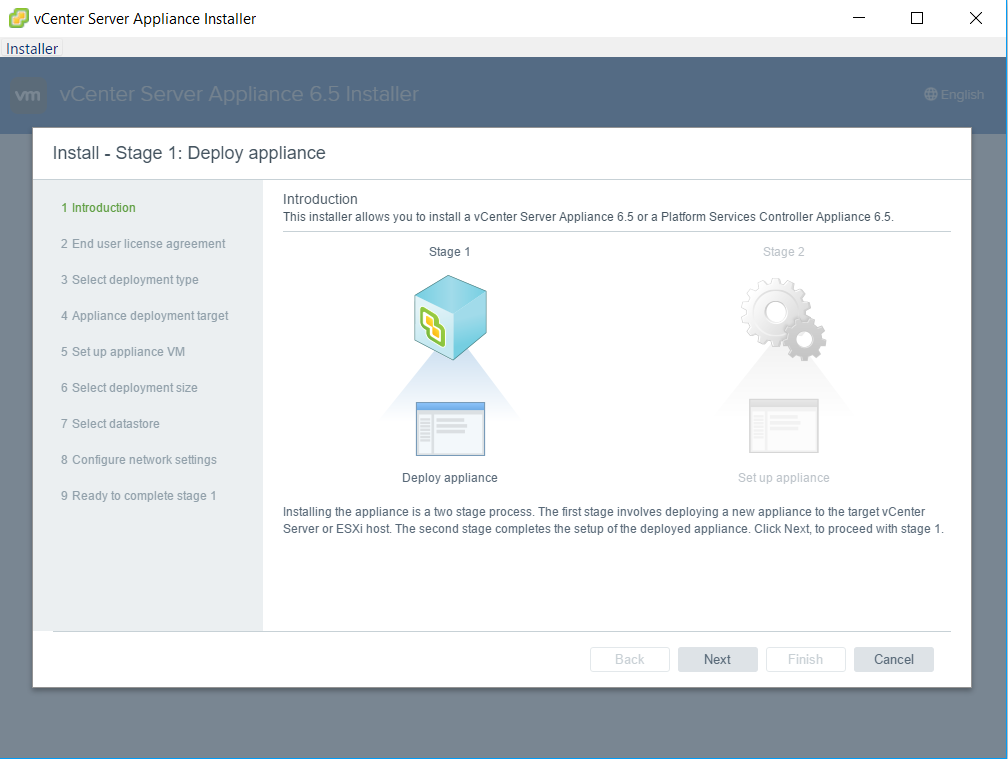
You will see the Introduction screen
Accept the License Agreement
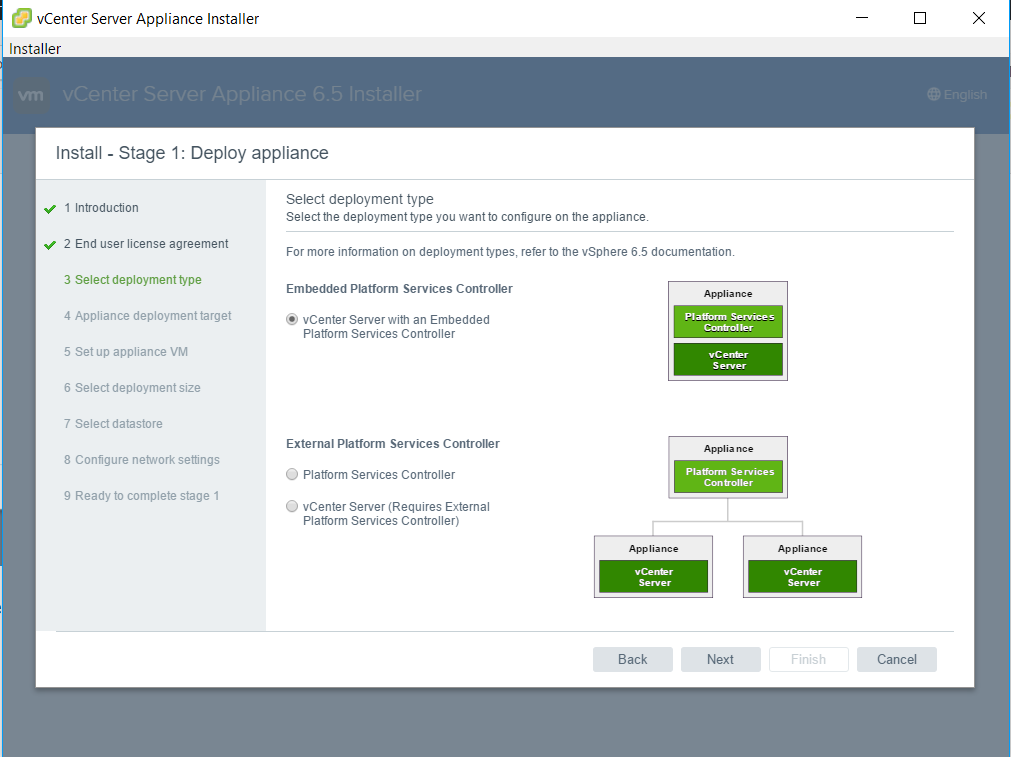
Select Deployment Type. For now I’m going to use an embedded Platform Service Controller
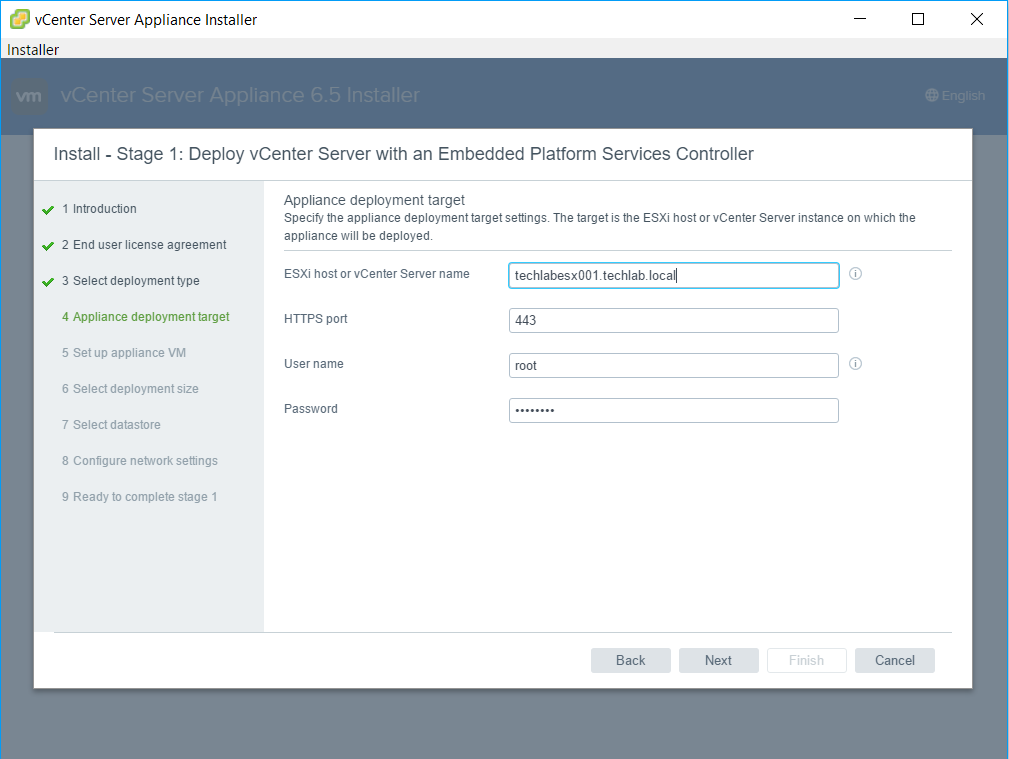
Enter the details for the appliance target. Try an IP Address if a FQDN doesn’t work.
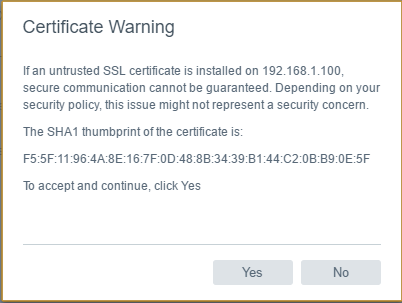
Accept the certificate
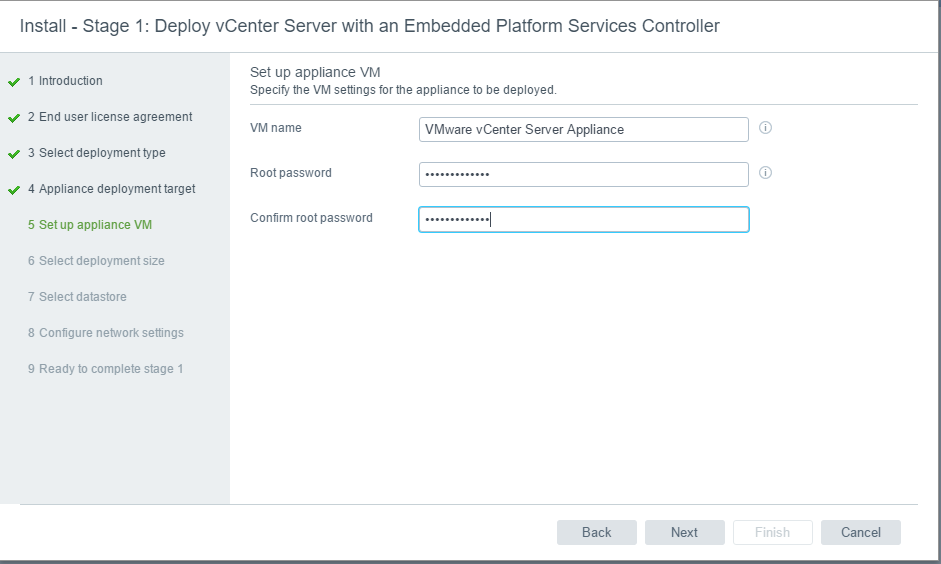
Put in a root password for the vCenter Server Appliance
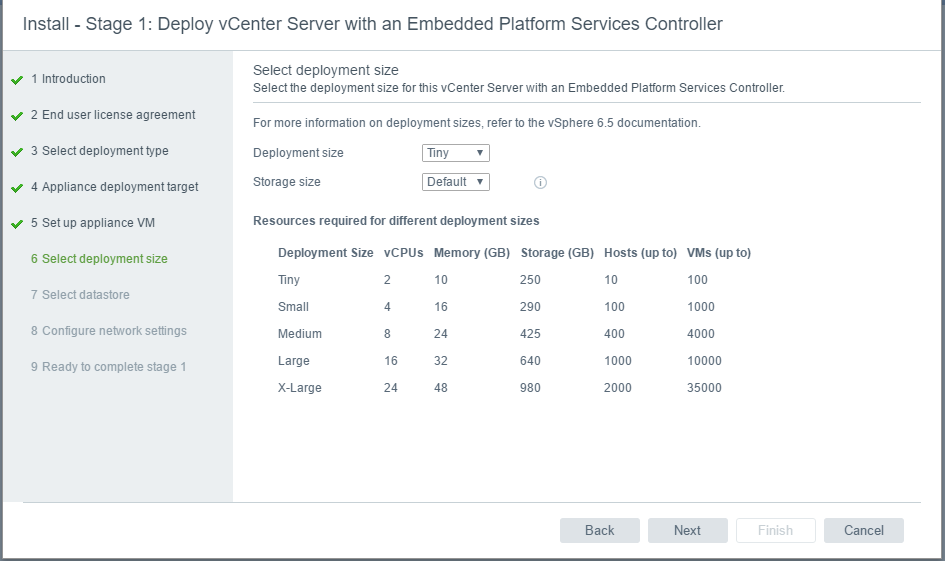
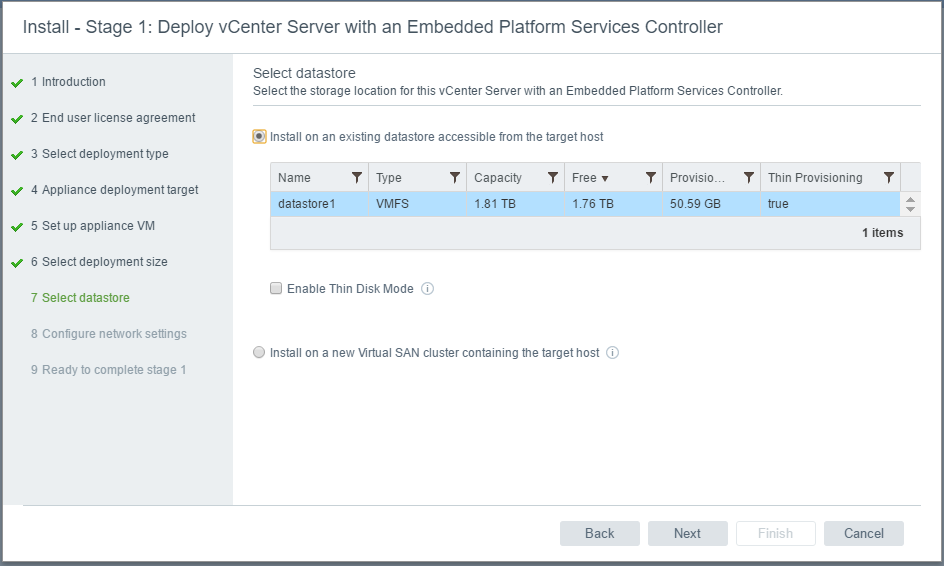
Select a deployment size
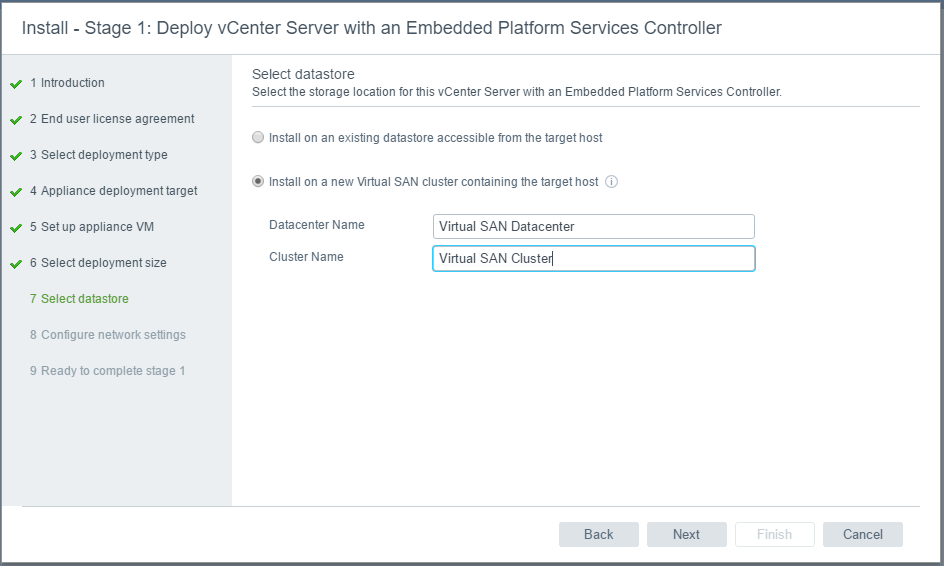
There are now 2 deployment types. You can install as normal or you can “Install on a new Virtual SAN cluster containing the target host”
I am going to test this new feature of a combined install of vCenter and vSAN placing the vCenter on vSAN
Put in a name for your Datacenter and Cluster and click Next. It will say Loading
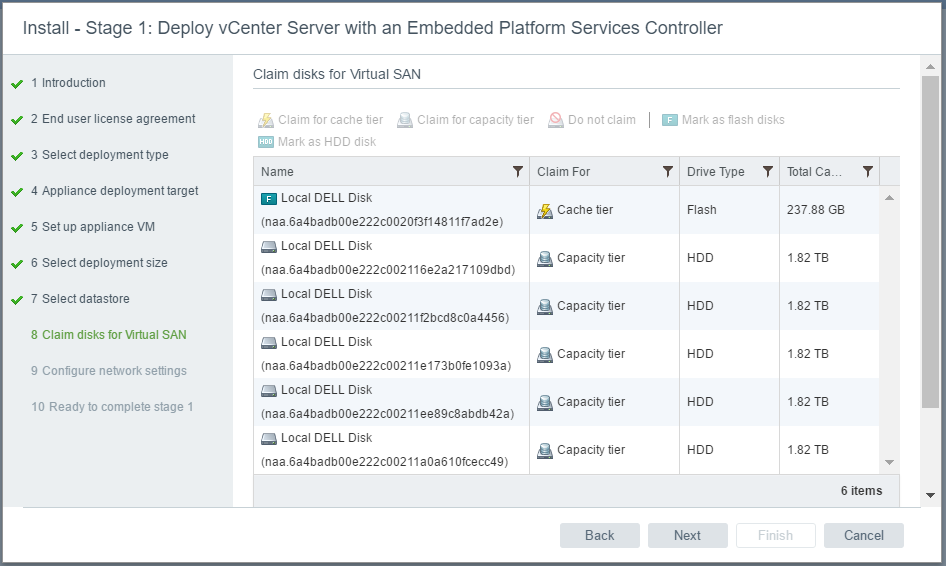
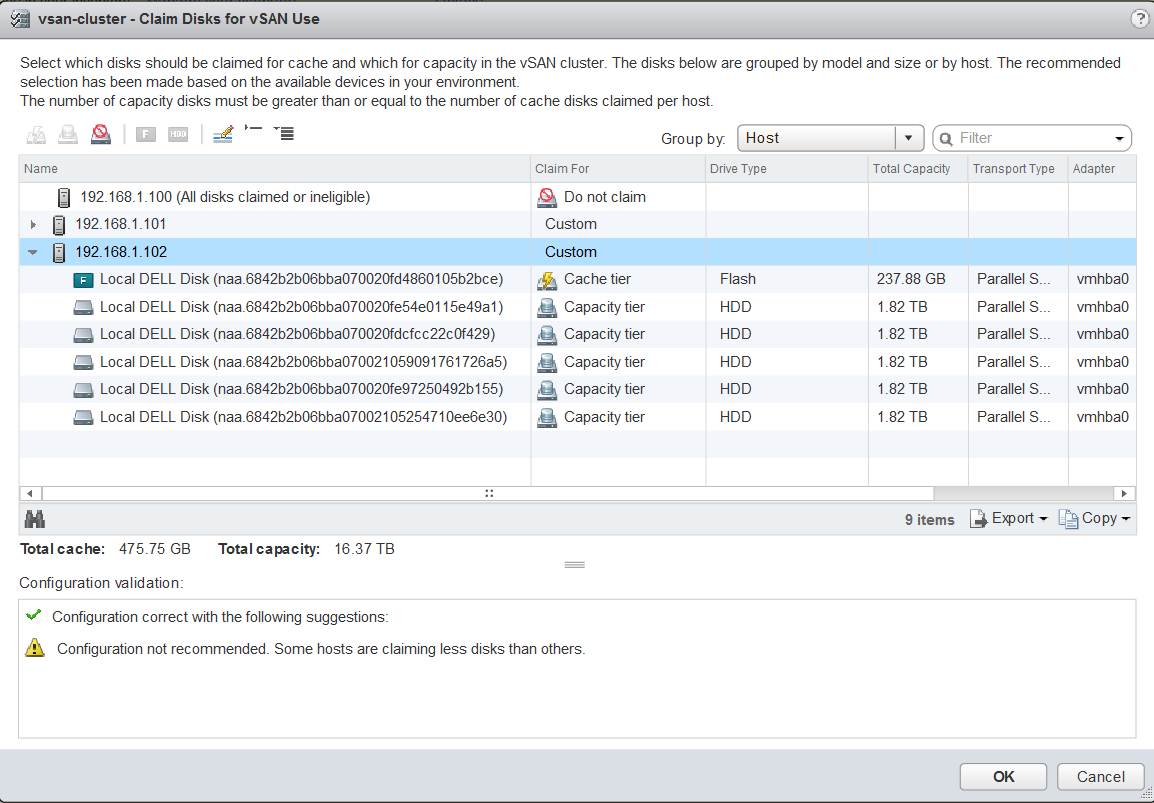
Claim disks for Virtual SAN. You can see it has picked up all my disks on my first host and recognizes the SSD and sets it as a cache Disk while the other non SSD Disks are set as Capacity Disks
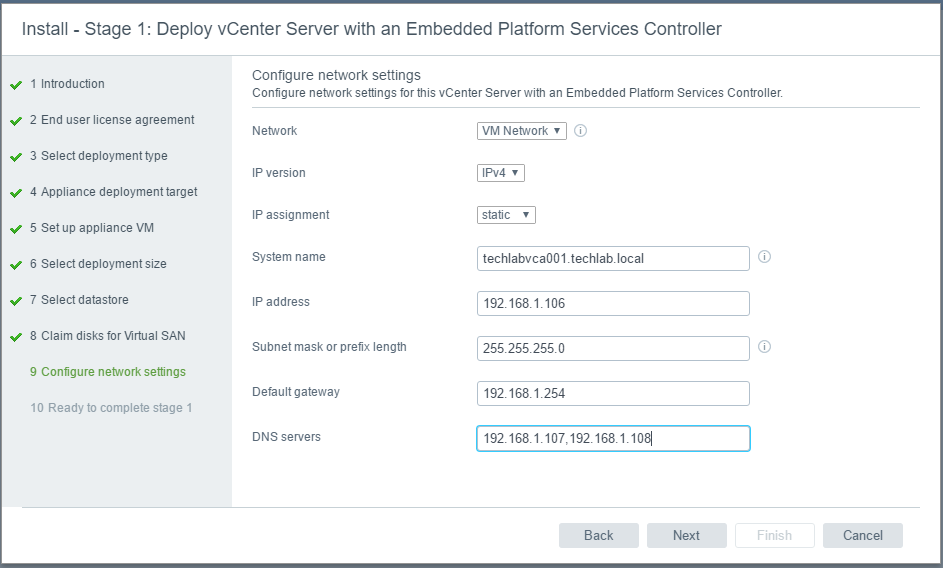
Next enter your network settings
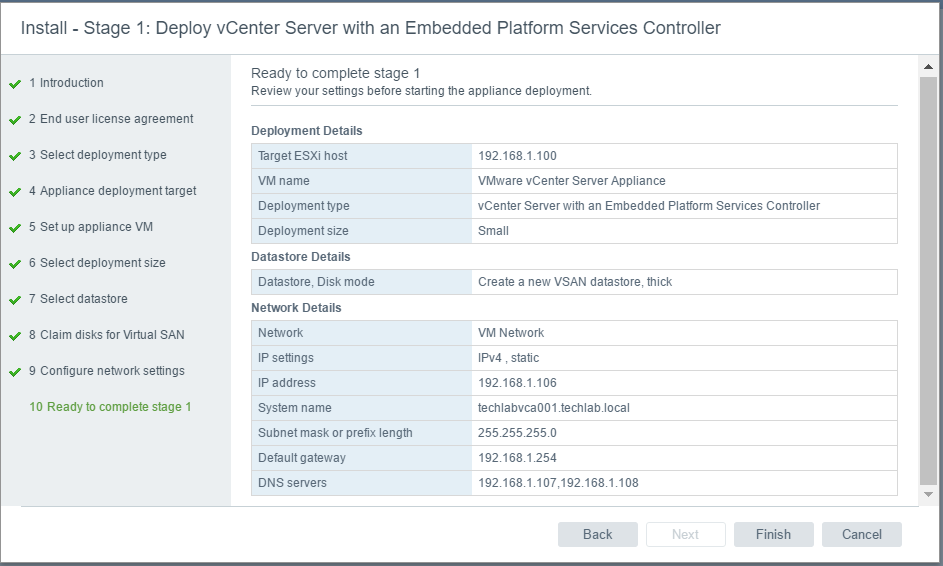
You are now ready to complete at Stage 1. Check the settings and click Finish
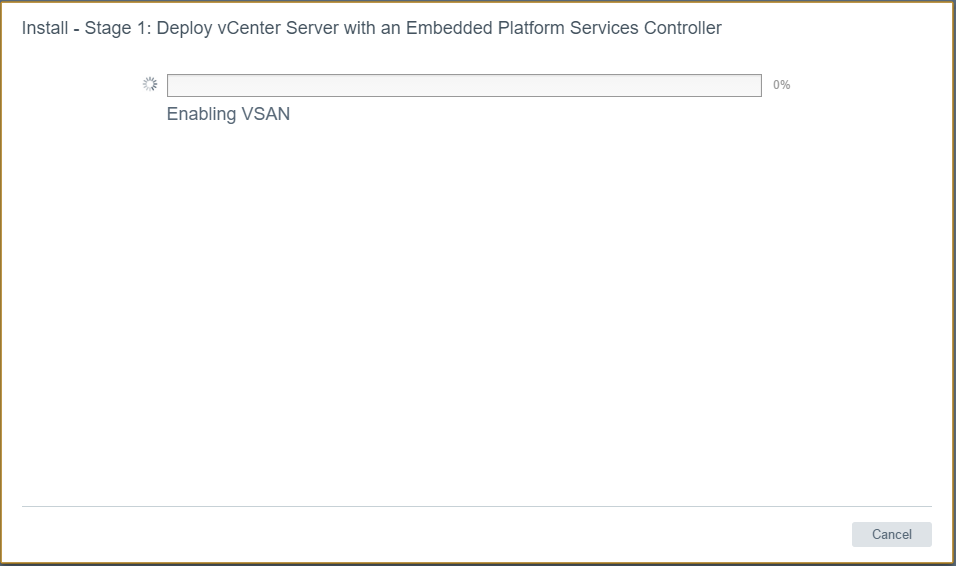
It will now show the following screen
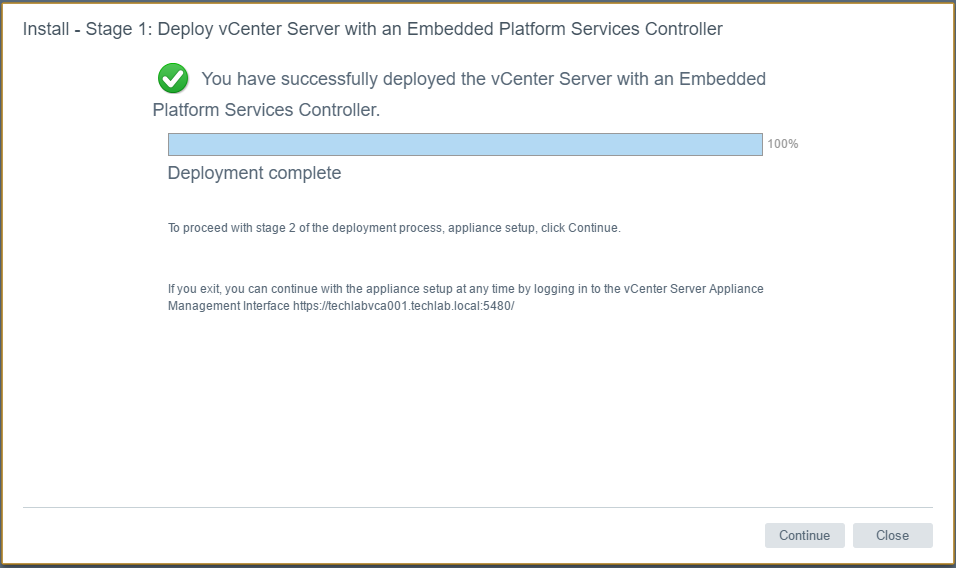
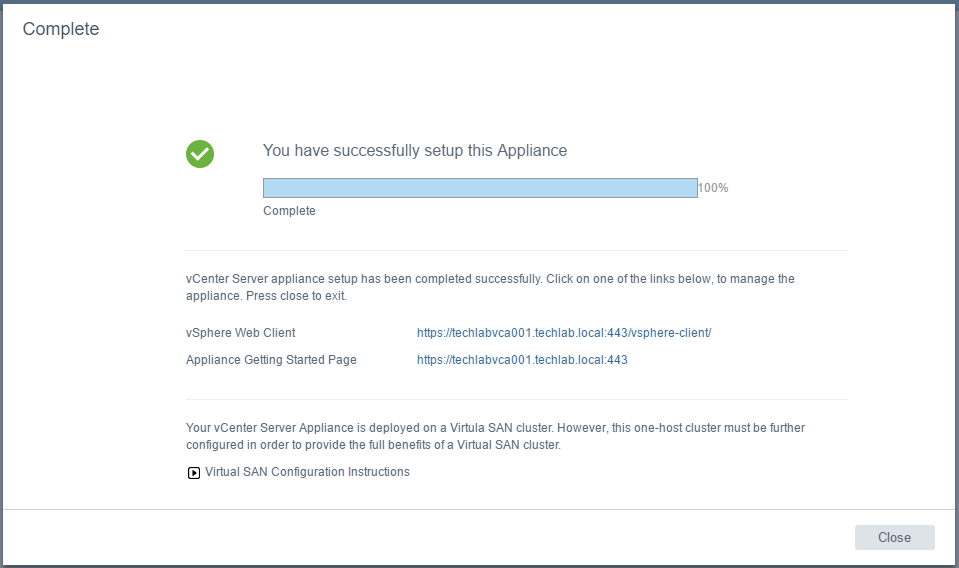
When it has finished you should see the below screen
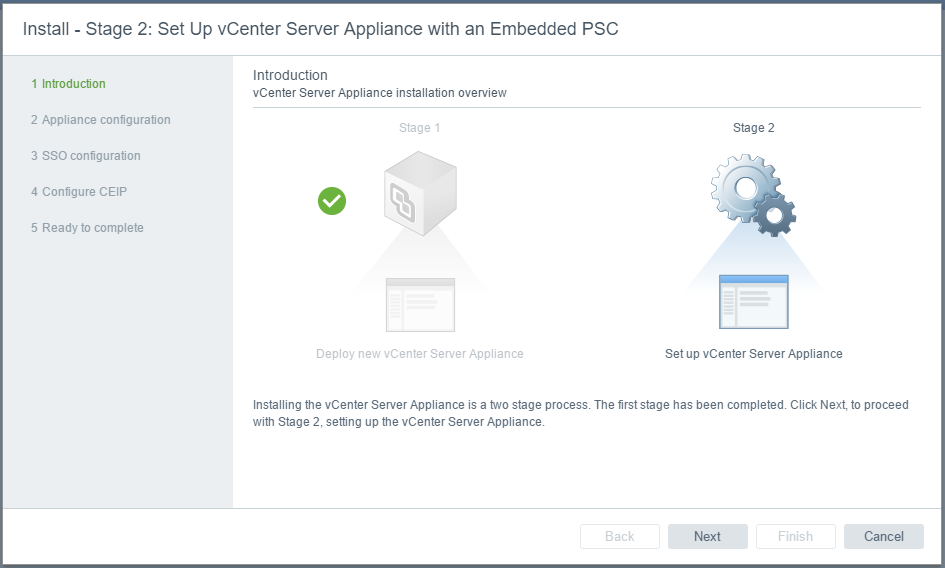
Click Continue and we will be on to Stage 2
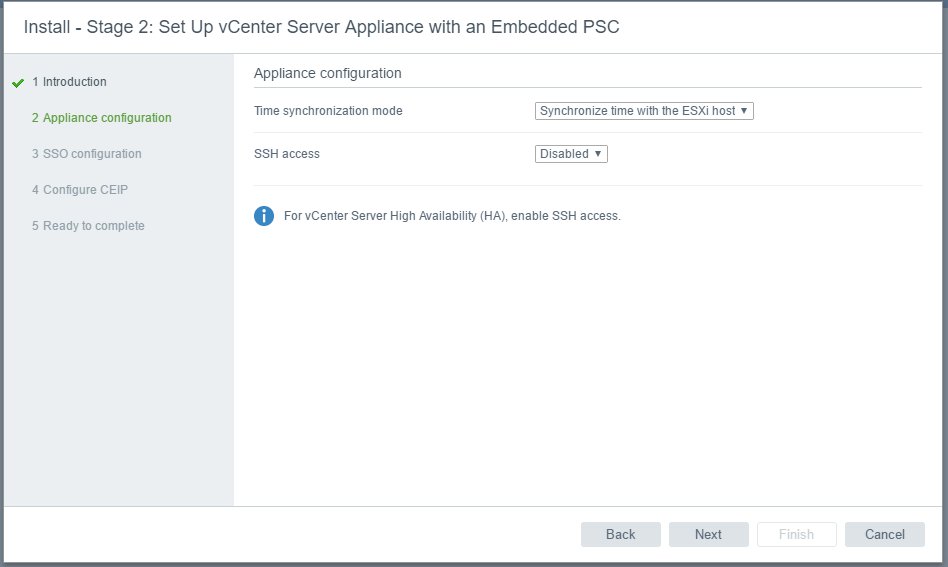
Next Enter the time settings. You can use NTP Servers or sync with the local host. You can also enable SSH
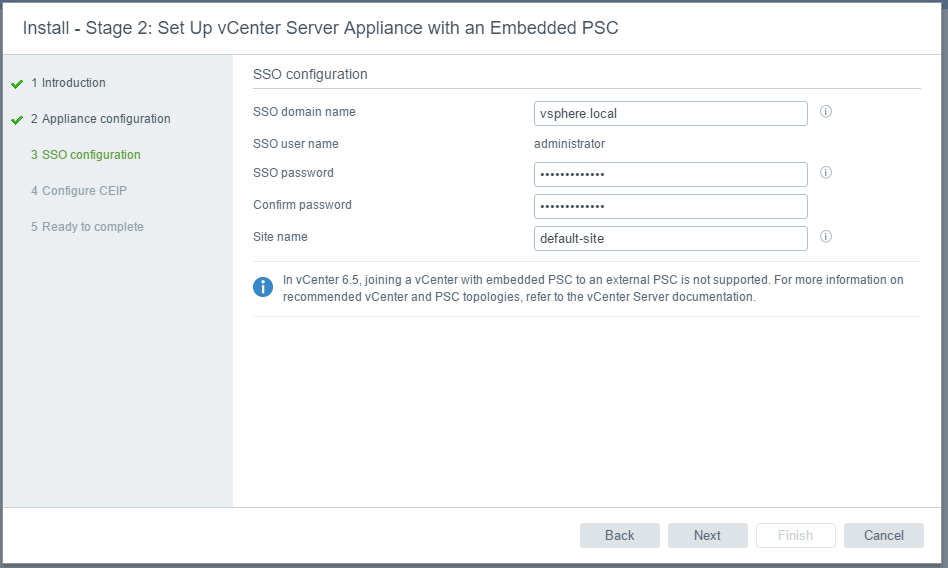
Next set up the embedded PSC
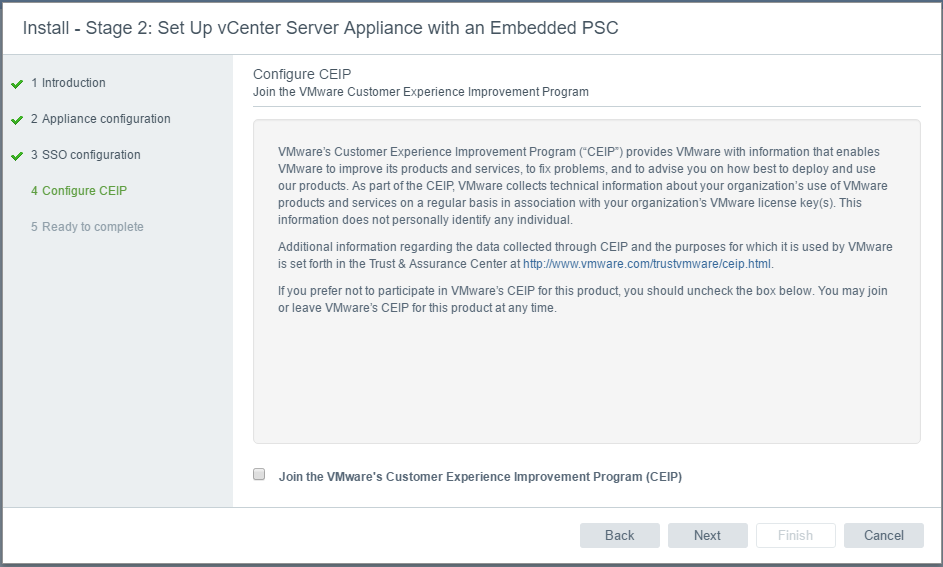
Next decide if you want to join the Customer Experience Program
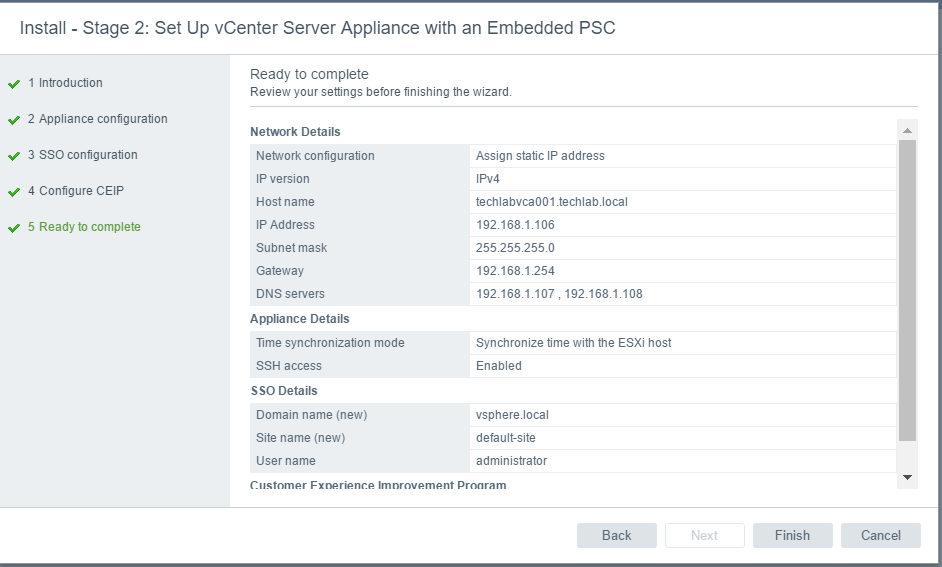
Finish and check the config
You should now see the below screen
When it has finished you will see the below screen
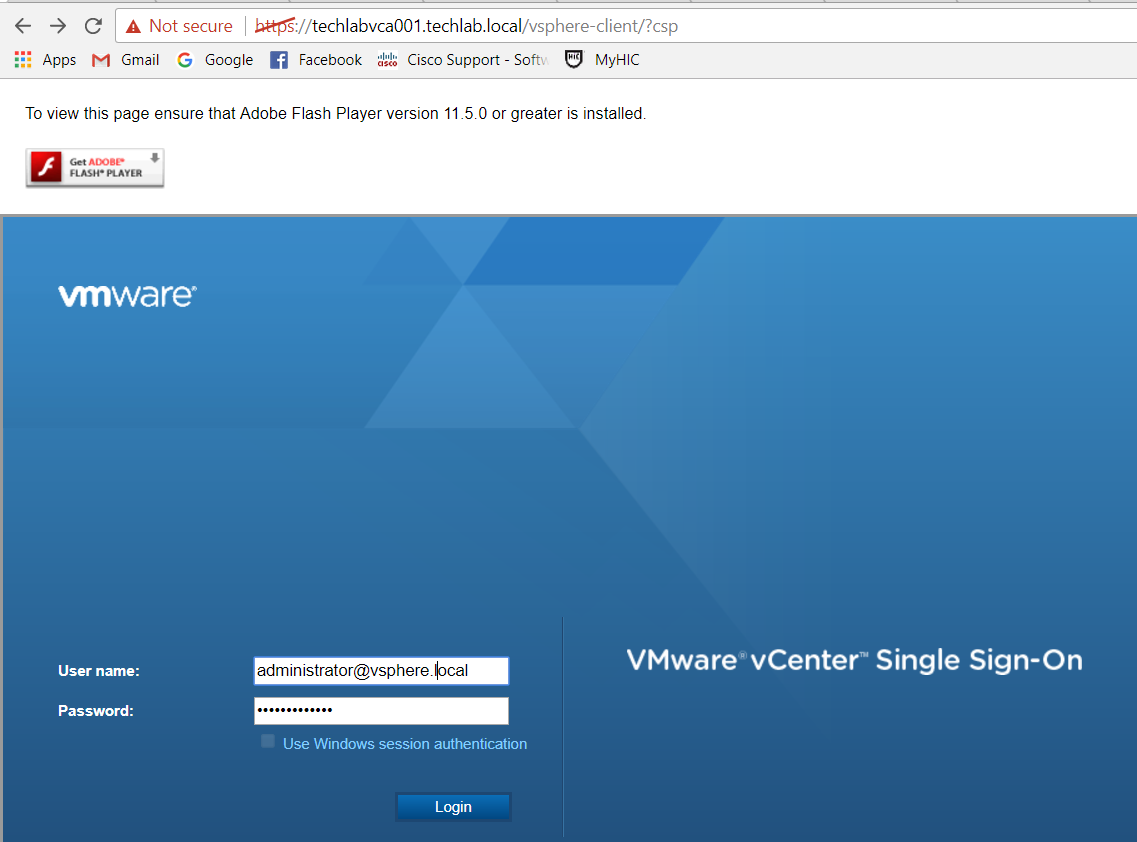
Next connect to the vCenter appliance with the administrator@vsphere.local account and the password you set up previously
Next I need to add my other 2 hosts to the Datacenter and create a vSAN VMkernel port on each host followed by adding them into the cluster
Click on the cluster > Select Configure > vSAN > Disk Management and select your disks on the other servers and make them either the cache disk or capacity disk
This process is normally quite quick and once complete you should have your vSAN up and running!
Click on the cluster > Select Configure > Services and Edit Settings to turn on HA and DRS
Once everything is looking ok click on the cluster > vSAN > General > Configuration Assist to check any errors or warnings about any issues so you can fix these.
Procedure to shutdown the vSAN cluster and start it up again.
So it crossed my mind that as this is my lab, it is not going to be running 24×7 or my house is going to be rather warm and my electricity bill will definitely rise! I need to power it off therefore what is the correct way to shut everything down and power up again?
Normally to shutdown an ESXi Cluster, using vCenter Webclient, ESXi hosts have to be put into maintenance mode and then ESXi hosts are powered off. Also to start ESXi Cluster, vCenter Server is used to remove them from maintenance mode after powering on the hosts. However if the VSAN cluster is running management components such as vCenter Server and other management VMs, the ESXi host that is running vCenter Server cannot be put into maintenance mode. So vSAN Cluster shutdown and starting procedures have to be properly sequenced.
Start by powering off all virtual machines on ESXi cluster except the vCenter Server. If your Management cluster has ActiveDirectory which provides services to vCenter Server, then do not power off Active Directory VM as well
Migrate the vCenter Server VM and ActiveDirectory VM(s) to a single ESXi Host
Place all the remaining hosts in the cluster into maintenance mode. When confirming the maintenance mode for ESXi Host, ensure the following selection is made ( deselect checkbox for Move powered-off VMs and “No data migration” is chosen for Virtual SAN data migration)
You can put the hosts in Maintenance Mode manually as per the baove step or you can use a command line command. You can run the ESXCLI command below to put a host in Maintenance mode. However, you must perform this operation through one of the CLI methods that supports setting the VSAN mode when entering Maintenance Mode. You can either do this by logging directly into the ESXi Shell and running ESXCLI.
esxcli system maintenanceMode set -e true -m noAction
other options are
esxcli system maintenanceMode set -e true -m ensureObjectAccessibility
esxcli system maintenanceMode set -e true -m evacuateAllData
Power off the vCenter Server VM and Active Directory VM. At this point, the vSphere WebClient access is lost.
Shutdown all ESXi Hosts. This will complete the Shutdown procedure for VSAN Cluster.
Starting the ESXi Hosts and the vSAN back up
The procedure to start a vSAN Cluster begins with the ESXi host where vCenter Server and Active Directory VMs are running.
Power on all ESXi hosts in the cluster.
Take the hosts out of maintenance mode
Identify ESXi host where vCenter Server and Active Directory VMs are located
Power on AD servers
Power on vCenter server
Note: If the vCenter Server VM has a vmnic that is tied to a VDS network, then vCenter Server can’t be powered on because VM power-on operation on VDS requires vCenter Server to be running. So it is recommended to move any vmnic on vCenter Server to a vSwitch-based network. This can be moved back to the VDS Network afterwards
Log into vCenter and check vSAN
Useful Troubleshooting Tools
rvc console on vCenter
Putty
esxcli commands
I had an issue at a customer site where they had put some hosts in Maintenance Mode and when they brought them out again, the hosts came out of Maintenance Mode but the vSAN didn’t resulting in the misreporting of storage in your cluster. As a result storage policies will error and you won’t be able to put any more hosts in maintenance mode if there isn’t the visible storage to move them. Note: you won’t have lost any storage. The system will just think it’s not there until you put the host into Maintenance Mode and take it out again for a second time! VMware are aware of this issue which seems to be present in 6.5U1 however this was a customers automated system. I haven’t seen this happen in my home lab!
By running the command vsan.cluster_info 0 in rvc, you are able to see for every disk whether the node is evacuated or not. If you have taken the host out of Maintenance Mode and the vSAN has also come out of Maintenance Mode then it will say Node evacuated: no. If it hasn’t come out properly it will say Node evacuated: yes (won’t accept any new components)
VMware’s explanation is “Software Defined Storage is the automation and pooling of storage through a software control plane, and the ability to provide storage from industry standard servers. This offers a significant simplification to the way storage is provisioned and managed, and also paves the way for storage on industry standard servers at a fraction of the cost.
Hyper-converged appliances (Nutanix, Scale Computing, Simplivity and Pivot3
Software only solutions. Deployed as a VM on top of a hypervisor (VMware vSphere Storage Appliance, Maxta, HP’s StoreVirtual VSA, and EMC Scale IO)
VSAN 5.5
VSAN is also a software-only solution, but VSAN differs significantly from the VSAs listed above. VSAN sits in a different layer and is not a VSA-based solution.
VSAN Features
Provide scale out functionality
Provide resilience
Storage policies per VM or per Virtual disk (QOS)
Kernel based solution built directly in the hypervisor
Performance and Responsiveness components such as the data path and clustering are in the kernel
Other components are implemented in the control plane as native user-space agents
Uses industry standard H/W
Simple to use
Can be used for VDI, Test and Dev environments, Management or DMZ infrastructure and a Disaster Recovery target
32 hosts can be connected to a VSAN
3200 VMs in a 32 host VSAN cluster of which 2048 VMs can be protected by vSphere HA
VSAN Requirements
Local host storage
All hosts must use vSphere 5.5 u1
Autodeploy (Stateless booting) is not supported by VSAN
VMkernel interface required (1GbE) (10gBe recommended) This port is used for inter-cluster node communication. It is also used for reads and writes when one of the ESXi hosts in the cluster owns a particular
VM but the actual data blocks making up the VM files are located on a different ESXi host in the cluster.
Multicast is enabled on the VSAN network (Layer2)
Supported on vSphere Standard Switches and vSphere Distributed Switches)
Performance Read/Write buffering (Flash) and Capacity (Magnetic) Disks
Each host must have at least 1 Flash disk and 1 Magnetic disk
3 hosts per cluster to create a VSAN
Other hosts can use the VSAN without contributing any storage themselves however it is better for utilization, performance and availability to have a uniformly contributed cluster
VMware hosts must have a minimum of 6GB RAM however if you are using the maximum disk groups then 32GB is recommended
VSAN must use a disk controller which is capable of running in what is commonly referred to as pass-through mode, HBA mode, or JBOD mode. In other words, the disk controller should provide the capability to pass up the underlying magnetic disks and solid-state disks (SSDs) as individual disk drives without a layer of RAID sitting on top. The result of this is that ESXi can perform operations directly on the disk without those operations being intercepted and interpreted by the controller
For disk controller adapters that do not support pass-through/HBA/JBOD mode, VSANsupports disk drives presented via a RAID-0 configuration. Volumes can be used by VSAN if they are created using a RAID-0 configuration that contains only a single drive. This needs to be done for both the magnetic disks and the SSDs
VMware VSAN compatibility Guide
VSAN has strict requirements when it comes to disks, flash devices, and disk controllers which can be complex. Use the HCL link below to make sure you adhere to all supported hardware
Don't think about what can happen in a month. Don't think what can happen in a year. Just focus on the 24 hours in front of you and do what you can to get closer to where you want to be :-)