ESXTOP and RESXTOP
Are used to analyze real-time performance data from an individual ESX or ESXi server.
The fundamental difference between resxtop and esxtop is that you can use resxtop remotely, whereas you can start extop only through the ESXi Shell of a local ESXi host.
You can start either utility in one of three modes:
- Interactive (default)
- Batch
- Replay
Running ESXTOP/RESXTOP
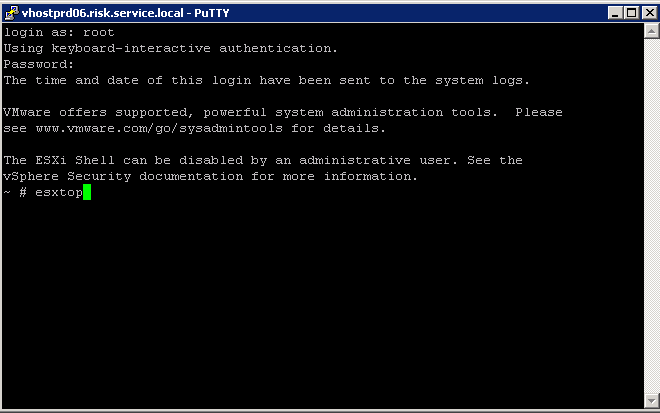
Type esxtop/resxtop into one of the following consoles
- Putty
- vMA (vSphere Management Assistant) virtual appliance.
- vCLI
- Power CLI
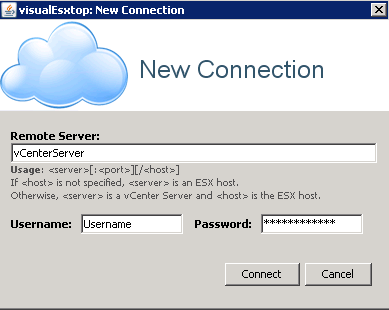
When running RESXTOP you will have to specify the ESX or ESXi server hostname, username, and password, as you see below

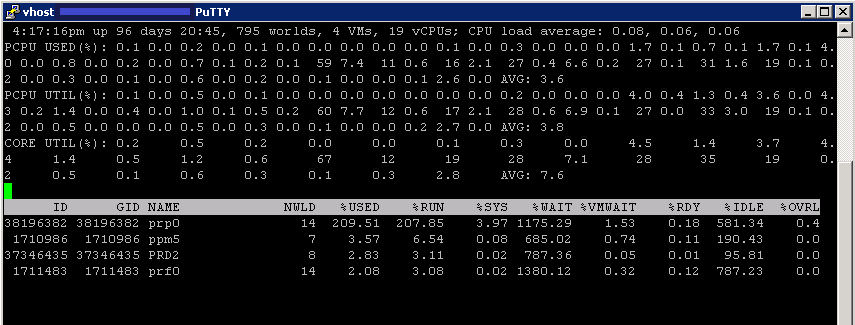
What you will see first

The elapsed time since the server has been powered on.
The total number of worlds on ESX(i) Server (Like Processes)
The arithmetic mean of CPU loads in 1 minute, 5 minutes, and 15 minutes, based on 6-second samples. CPU load accounts the run time and ready time for all the groups on the host.
A load average of 0.50 means that the physical CPUs on the ESXi system
are half utilized.
A load average of 1.00 means that the physical CPUs on the ESXi system
are fully utilized.
A load average of 2.00 means that means that the physical CPUs on the ESXi system
are doubly utilized and the ESXi system might need twice as many physical CPUs as are currently available.
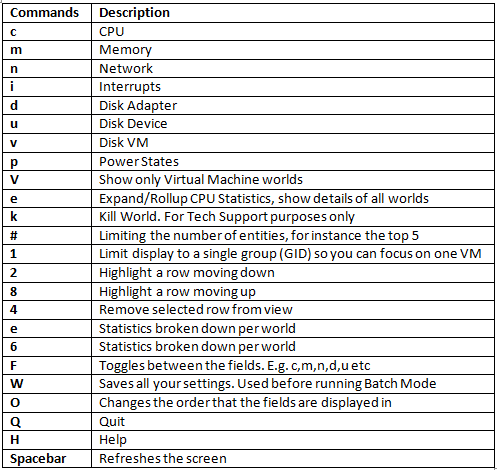
Accessing the 8 different displays
You’ll find that ESXTOP/RESXTOP has 8 different “displays” that show CPU, interrupt, memory, network, disk adapter, disk interface, disk VM, and power management. These are accessed by typing the letters below
Commands by letter
Running esxtop in Batch Mode
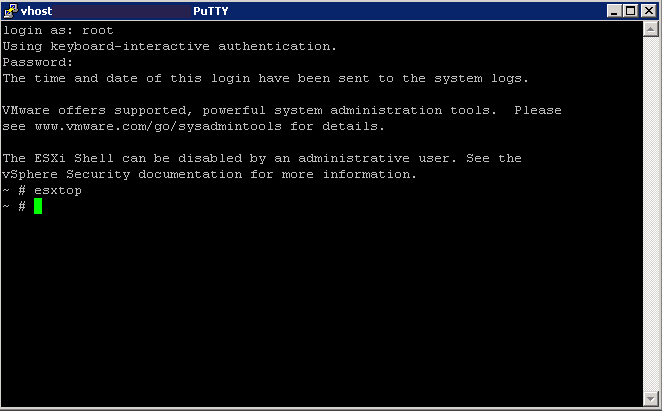
- Log into the host using whichever console you feel comfortable with. E.g. Putty
- Type esxtop
- Type V (Capital V) to just show the VMs
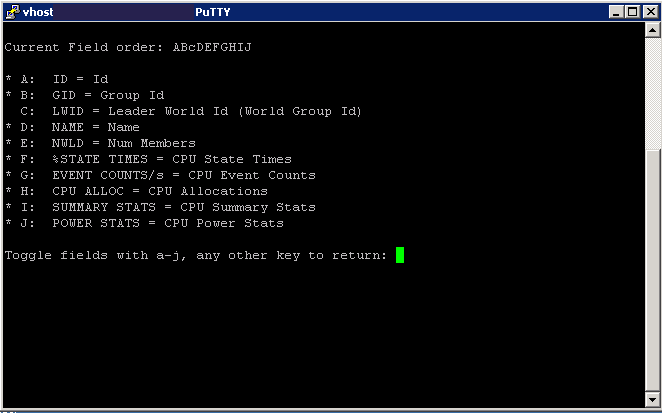
- By default you are on the CPU Screen. If you then type f (lower case) you can toggle between what CPU fields to view. Type the letter to activate the relevant field
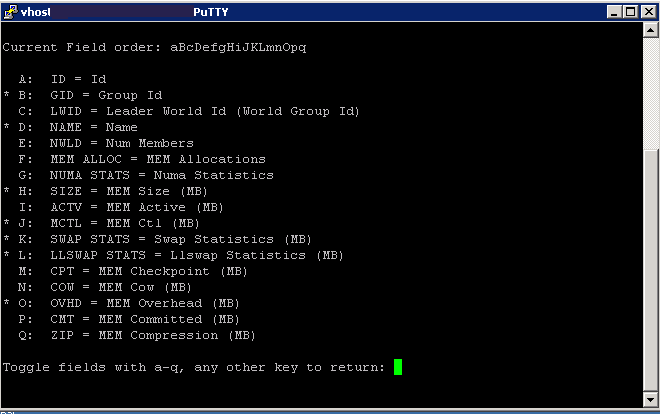
- Press any key to return to the main screen and now press m (lower case) for Memory and then press f to see the fields. Type the letter to activate the relevant field
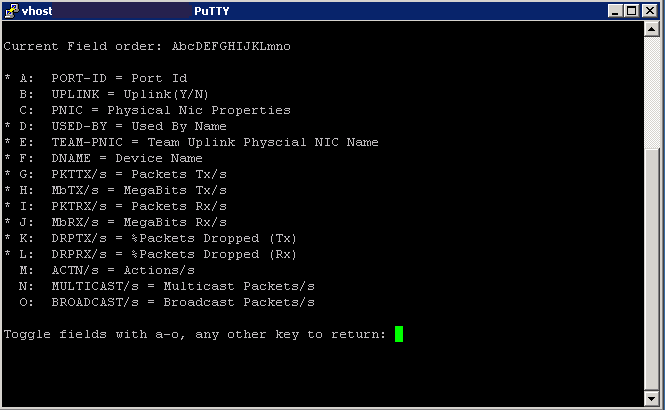
- Press any key to return to the main screen then type n (lower case) for Network and type f to see the fields. Type the letter to activate the relevant field
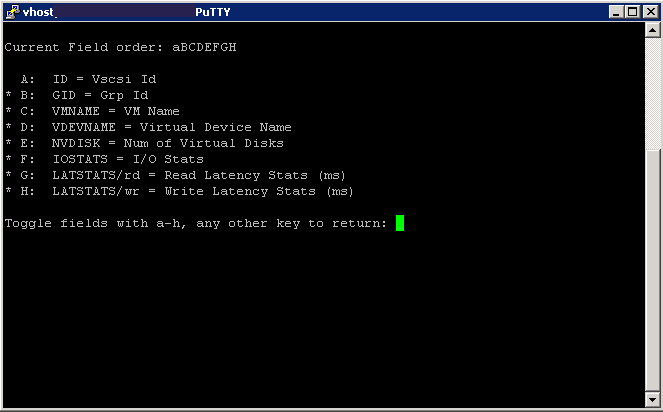
- Press any key to return to the main screen and now press v (lower case) for VM Disk and then press f to see the fields. Type the letter to activate the relevant field.
- Now you have selected all your fields, you need to press W (Capital W) to save your settings then press Enter
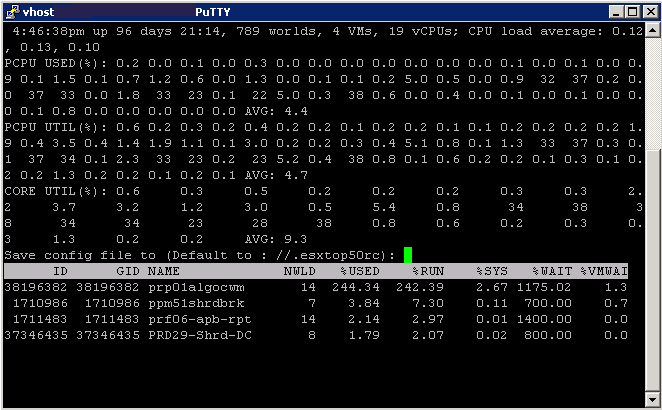
- You should see the following screen flash up quickly
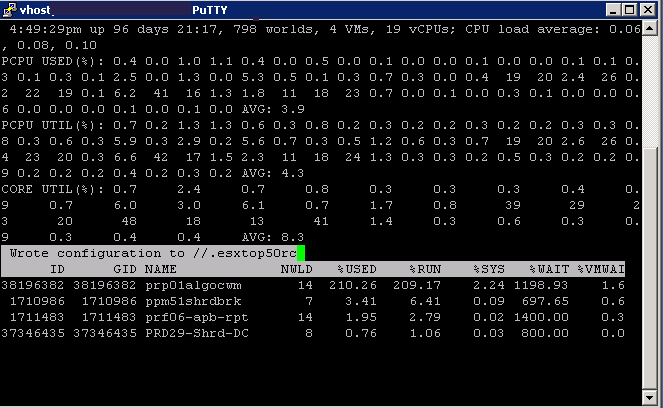
- Type q to quit and go back to your normal command line
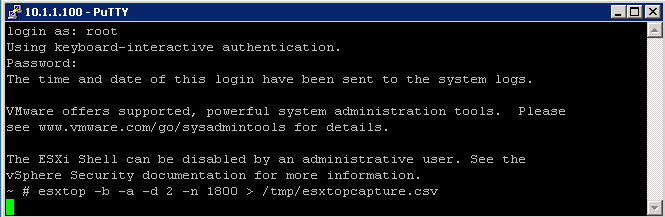
- You now need to run it in batch mode and save the results to a .csv file:
- Type esxtop -b -a -d 2 -n 1800 > /tmp/esxtopcapture.csv
Where “-b” stands for batch mode, “-d 2″ is a delay of 2 seconds and “-n 1800″ are 3600 iterations. In this specific case esxtop will log all metrics for 1 Hour. If you want to record all metrics make sure to add “-a” to your string.
Analysing Data
You can use multiple tools to analyze the captured data. Underlined are links to the software
- VisualEsxtop
- perfmon
- excel
- esxplot
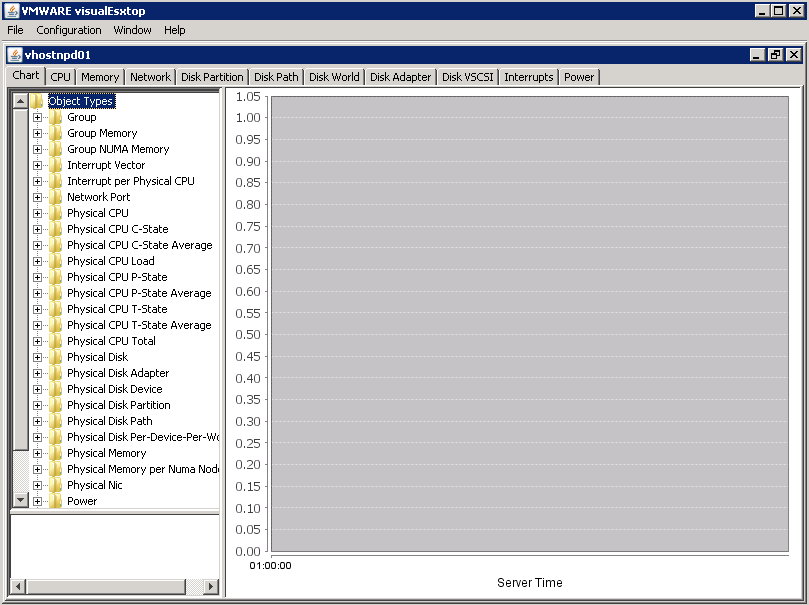
VisualEsxtop
VisualEsxtop is an enhanced version of resxtop and esxtop. VisualEsxtop can connect to VMware vCenter Server or ESX hosts, and display ESX server stats with a better user interface and more advanced features.
Features
- Live connection to ESX host or vCenter Server
- Flexible way of batch output
- Load batch output and replay them
- Multiple windows to display different data at the same time
- Line chart for selected performance counters
- Flexible counter selection and filtering
- Embedded tooltip for counter description
- Color coding for important counters
Instructions
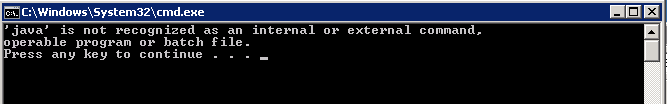
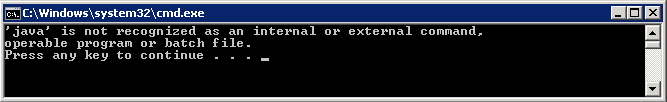
- Once it is download you must make sure that Java is installed or VisualEsxtop will not run. We have JRE 6 Update 29 installed. You can check this by running cmd.exe and typing java
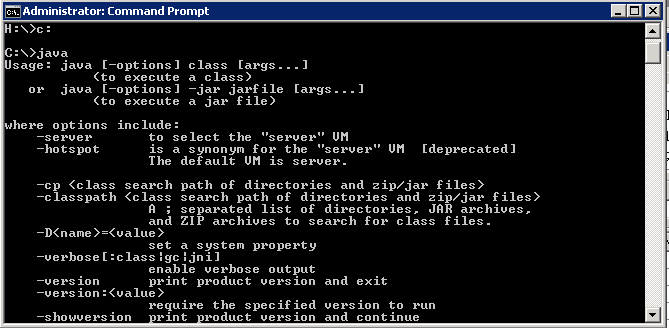
- If you don’t have Java installed correctly then you will get the following message
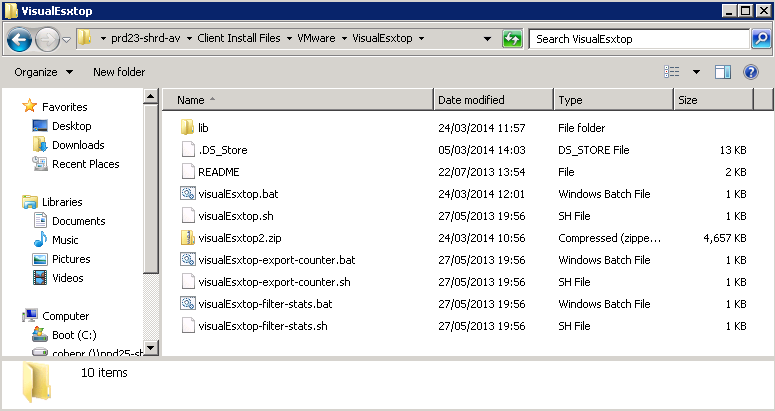
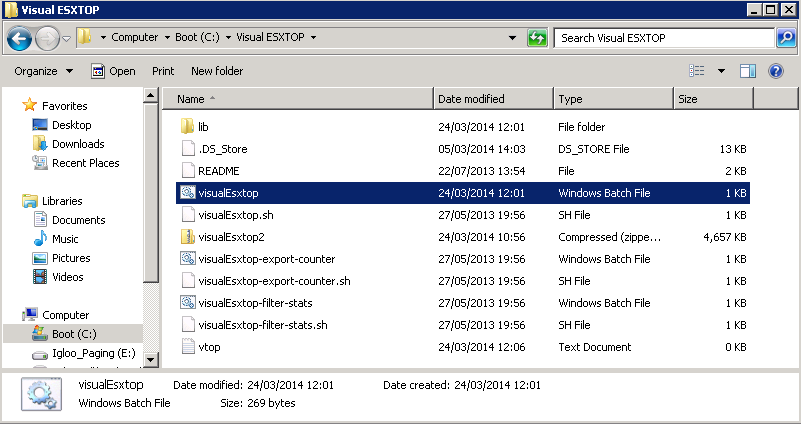
- For Windows, navigate to your VisualEsxtop folder and run the VisualEsxtop.bat file
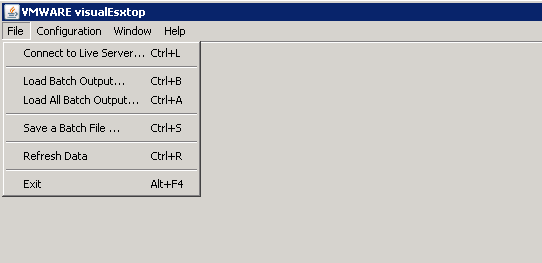
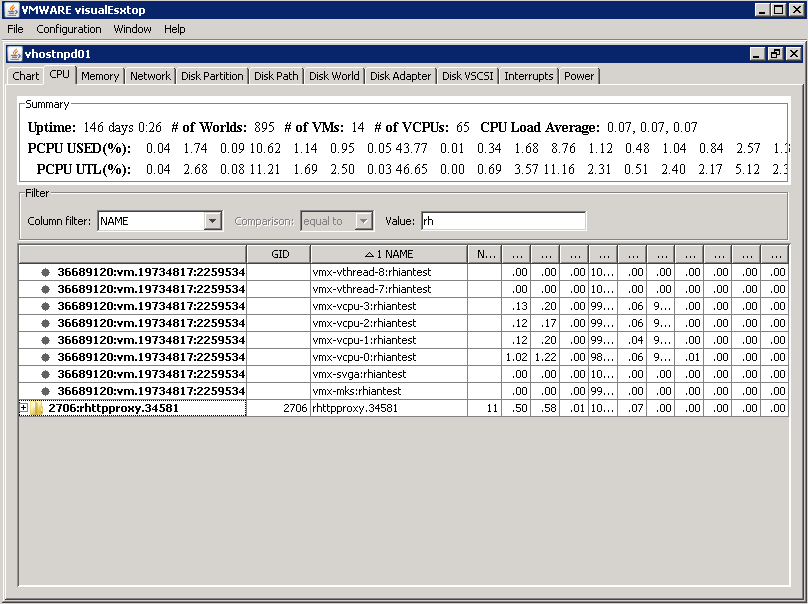
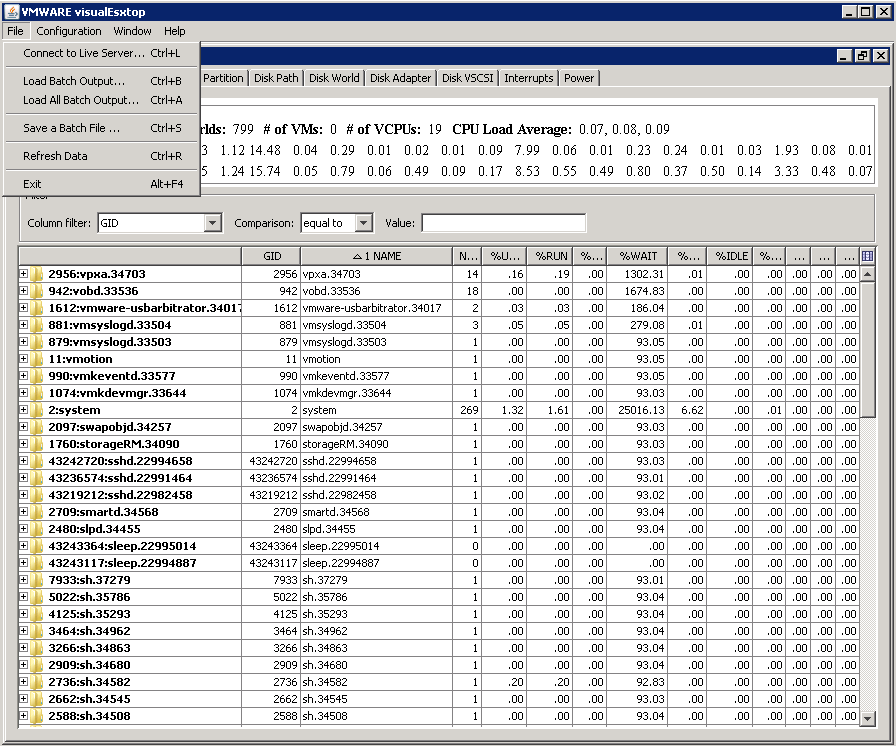
- It should open the below application
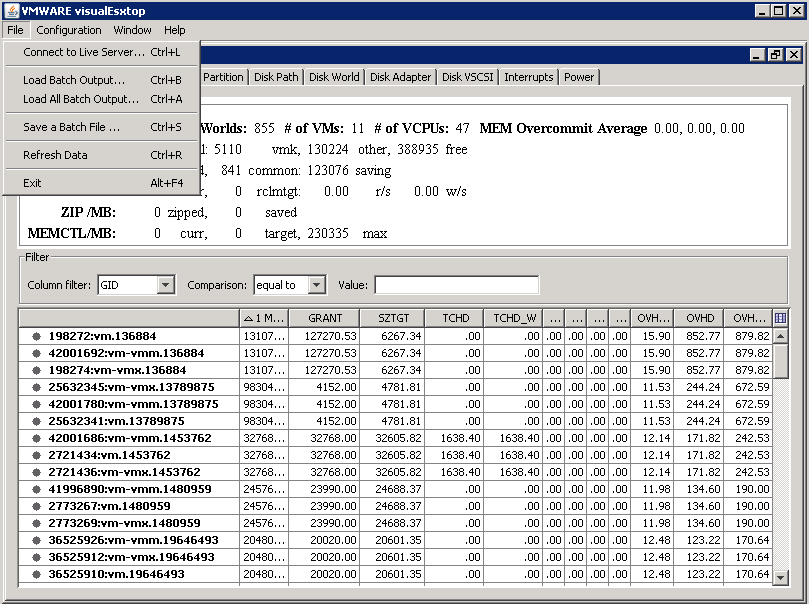
- Click File > Load Batch Output and open your CSV output file from running ESXTOP in Batch Mode
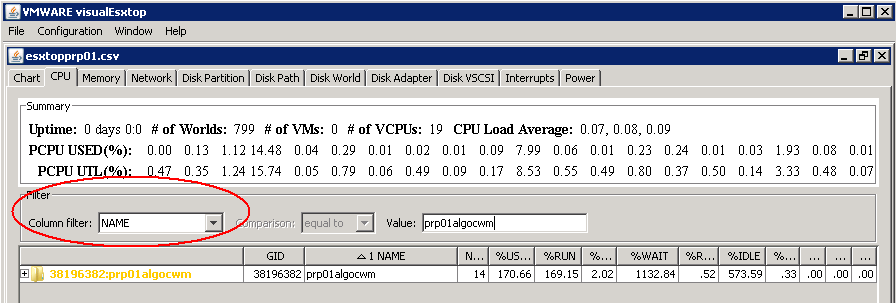
- You can then filter as well
https://labs.vmware.com/flings/visualesxtop
http://blogs.vmware.com/kb/2013/09/using-visualesxtop-to-troubleshoot-performance-issues-in-vsphere-2.html
Perfmon
- On your Windows Server, click Start > Run > Type perfmon
- Right click on the graph and select “Properties”.
- Select the “Source” tab.
- Select the “Log files:” radio button from the “Data source” section.
- Click the “Add” button.
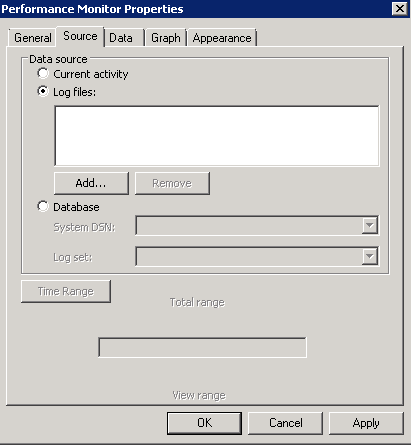
- Select the CSV file created by esxtop and click “OK”.
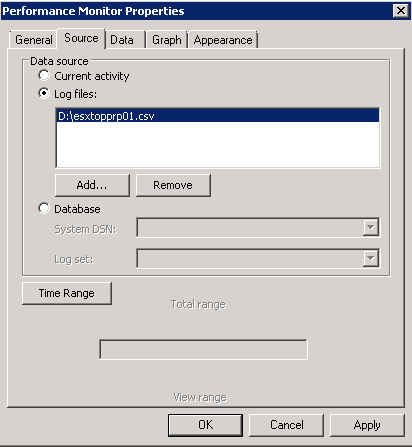
- Click the “Apply” button.
- Optionally: reduce the range of time over which the data will be displayed by using the sliders under the “Time Range” button.
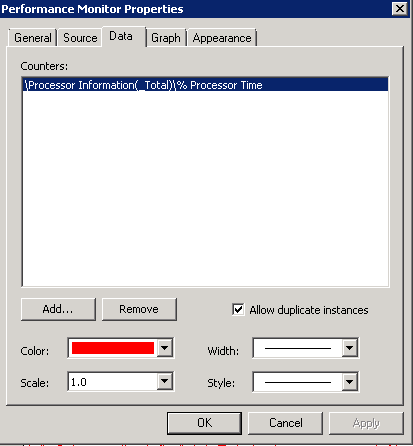
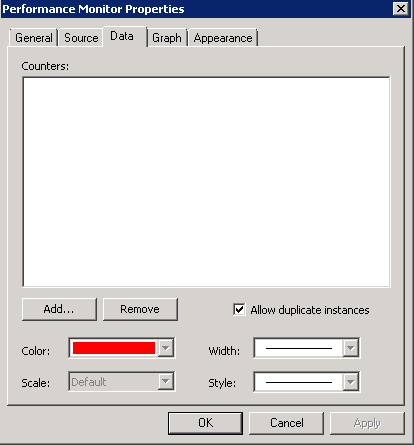
- Select the “Data” tab.
- Remove all Counters.
- Click “Add” and select appropriate counters. When you click on some of the counters, you can select the instance or VM/Machine you want to monitor directly
- Click Add
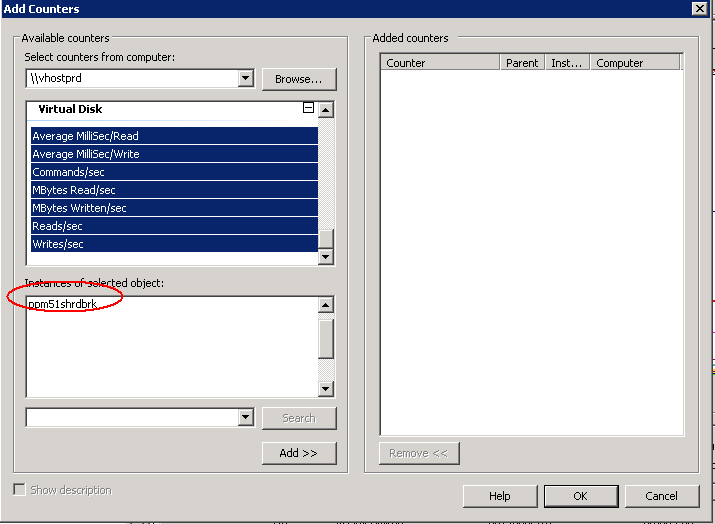
- Click “OK”
- Click “OK”
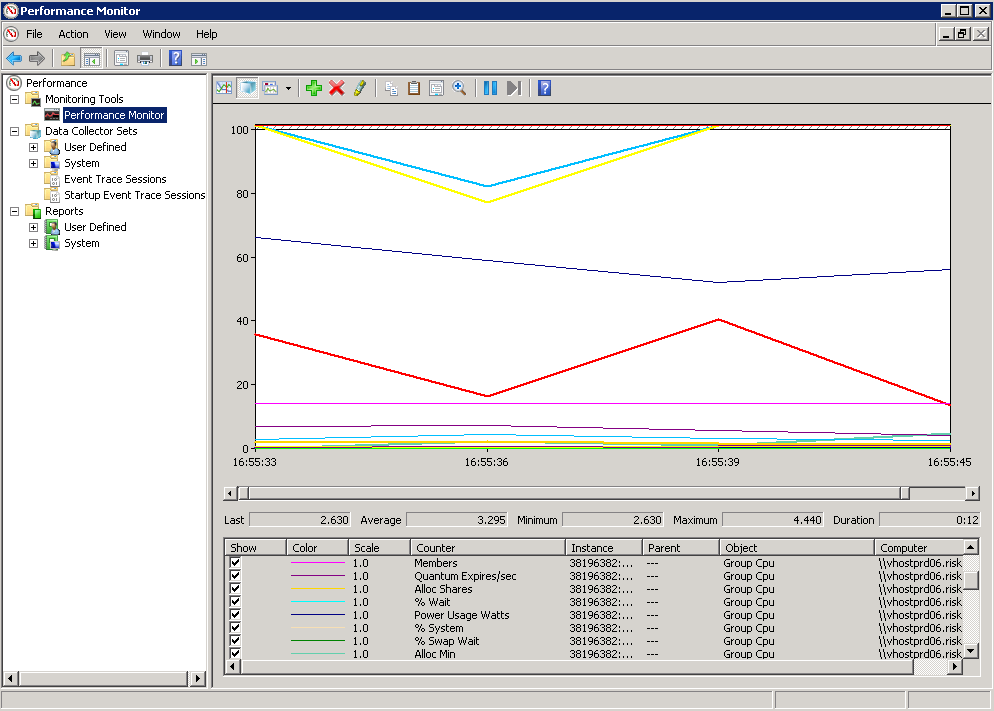
- You should now see the graph of values
Using ESXPLOT
Please see the below link for instructions
- Run: esxplot
- Click File -> Import -> Dataset
- Select file and click “Open”
- Double click host name and click on metric
http://www.electricmonk.org.uk/2012/09/05/esxplot/
Using MS Excel
Within Excel it is also possible to import the data as a CSV. You need to be careful of the size of the file though as the amount of captured data is sometimes quite large so you might want to limit it by first importing it into perfmon and then select the correct timeframe and counters and export this to a CSV. You can import the CSV as per below instructions
- Run: Excel
- Click on “Data”
- Click “Import External Data” and click “Import Data”
- Select “Text files” as “Files of Type”
- Select file and click “Open”
- Make sure “Delimited” is selected and click “Next”
- Deselect “Tab” and select “Comma”
- Click “Next” and “Finish
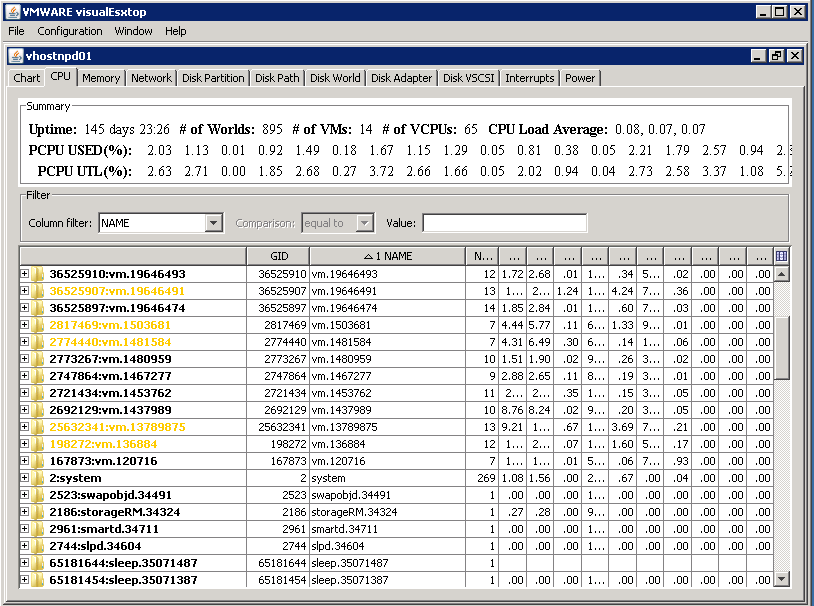
Looking at esxtop values and results (Realtime)
General CPU Statistics

First visible CPU Statistics
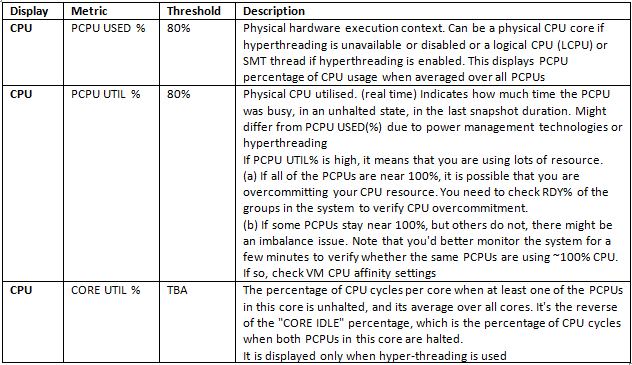
Optional Fields for CPU Performance Monitoring

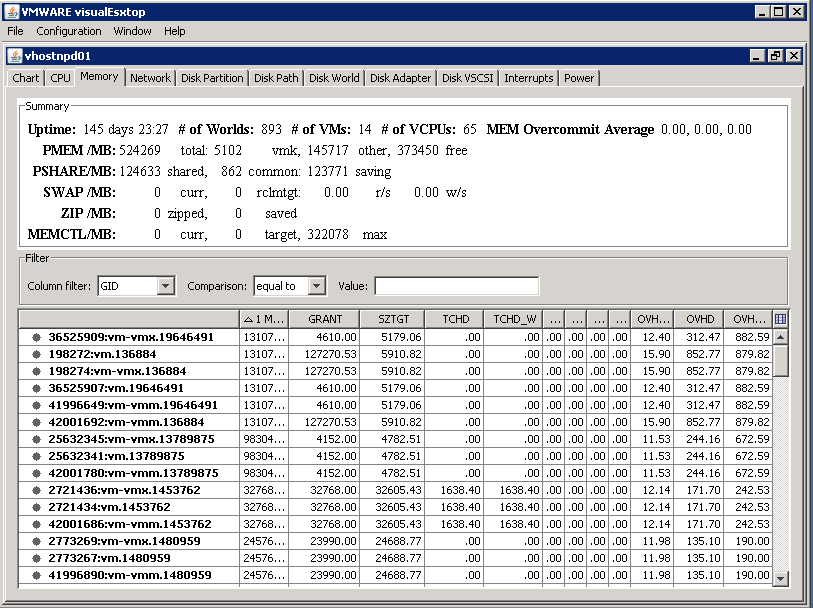
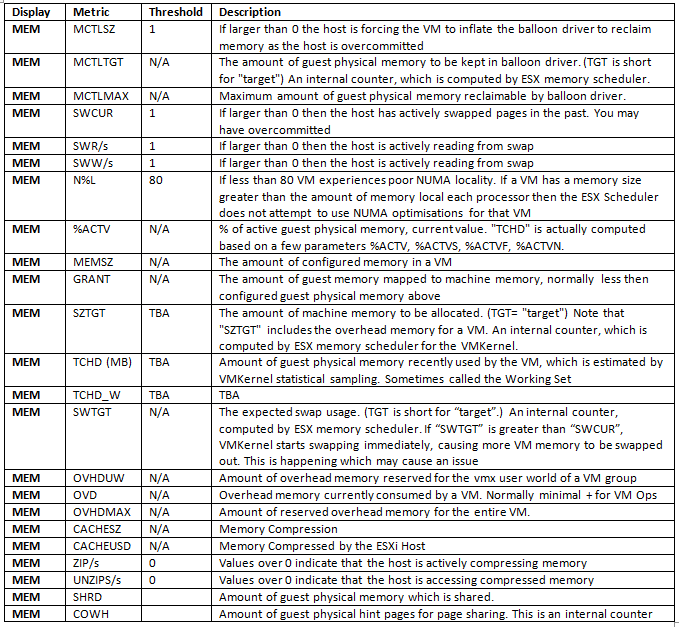
General Memory Statistics

First Visible Memory Statistics
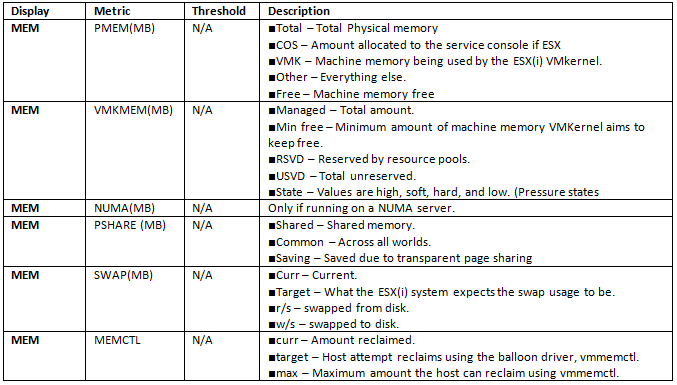
Optional Fields for Memory Performance Monitoring
General Disk Statistics

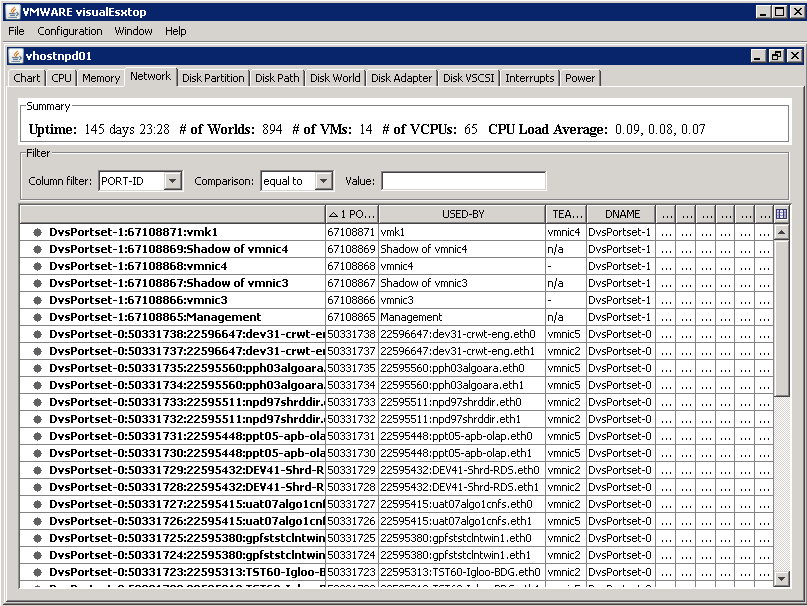
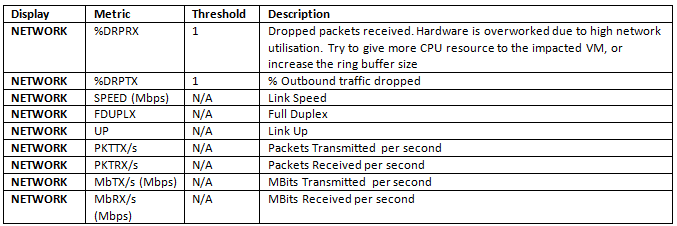
General Network Statistics
Running ESXTOP in Replay Mode
In replay mode, esxtop replays resource utilization statistics collected using vm-support.
After you prepare for replay mode, you can use esxtop in this mode.
In replay mode, esxtop accepts the same set of interactive commands as in interactive mode and runs until no more snapshots are collected by vm-support to be read or until the requested number of iterations are completed.
To run in replay mode, you must prepare for replay mode.
- Run vm-support in snapshot mode on the ESX service console
- Type vm-support -S -d duration -I interval
- -S = Snapshot mode, prompts for the delay between updates, in seconds
- -R = Path to the vm-support collected snapshot’s directory
- Unzip and untar the resulting tar file so that esxtop can use it in replay mode.
- tar -xf /root/esx*.tgz
- Now run the following
- esxtop -R root/vm-support*
http://www.vmwarearena.com/2012/08/esxtop-replay-mode.html
5 of the best posts for analysing results and statistics
http://www.yellow-bricks.com/esxtop/
http://communities.vmware.com/docs/DOC-9279
http://www.vmware.com/pdf/esx2_using_esxtop.pdf
http://simongreaves.co.uk/blog/esxtop-guide
http://communities.vmware.com/docs/DOC-5240
Analysing CPU/RAM/Network/Performance
http://communities.vmware.com/docs/DOC-3930