Tag Archive for I/O

Configure and Administer vSphere Network I/O Control

The-Traffic-Light

What is Network I/O Control?

Network I/O Control enables distributed switch traffic to be divided into different resource pools using Shares and Limits to control traffic priority applicable to a hosts outbound network I/O traffic only

Network resource pools determine the bandwidth that different network traffic types are given on a vSphere distributed switch.
When network I/O control is enabled, distributed switch traffic is divided into the following predefined network resource pools:

  • Fault Tolerance traffic
  • iSCSI traffic (Does not apply on a dependent hardware adapter)
  • vMotion traffic
  • Management traffic
  • vSphere Replication (VR) traffic
  • NFS traffic
  • Virtual machine traffic.

You can also create custom user defined network resource pools for Virtual Machine traffic

vSphere Replication

vSphere Replication is a new alternative for the replication of virtual machines. VR is introduced in vSphere Site Recovery Manager. VR is an engine that provides replication of virtual machine disk files. VR tracks changes to virtual machines and ensures that blocks that differ in a specified recovery point objective are replicated to a remote site

Configuring System Defined network Resource Pools

  • Select Home > Inventory > Networking
  • Select the Distributed Switch in the inventory and click the Resource Allocation tab
  • Click the Properties link and select Enable Network I/O Control on this vDS

Capture1

To enable network resource pool settings

  • Select the vDS
  • On the Resource Allocation Tab, right click the network resource pool and click Edit
  • Modify the physical adapter shares value and host limit for the network resource pool

Capture1

  • (Optional) Select the QoS priority tag from the drop down menu. The Qos priority tag specifies an IEE 802.1p tag enabling Quality of Service at the MAC level

Capture

  • Click OK

qos

Configuring User Defined Network Resource Pools

  • Click New Network Resource Pool
  • Put a Name
  • Put a Description
  • Choose an option in the drop-down for Physical Adapter Shares. Options are: High, Normal, Low or a Custom value.
  • Select Unlimited or not
  • Choose a level for QoS Priority Tag

Capture

Assign Port Groups to Network Resource Pools

  • Make sure you have created your own Network Resource Pool first
  • Click Manage Port Groups
  • Select a Network Resource Pool to associate with each Port Group

Capture

  • You can assign multiple Port Groups to the same Network Resource Pool

Capture

Analyse I/O Workloads to determine storage Performance Requirements

What causes Storage Performance issues?

Poor storage performance is generally the result of high I/O latency, but what can cause high storage performance and how to address it? Below are a list of things that can cause poor storage performance

Analysis of storage system workloads is important for a number of reasons. The analysis might be performed to understand the usage patterns of existing storage systems. It is very important for the architects to understand the usage patterns when designing and developing a new, or improving upon the existing design of a storage system. It is also important for a system administrator to understand the usage patterns when configuring and tuning a storage system

  • Under sized storage arrays/devices unable to provide the needed performance
  • I/O Stack Queue congestion
  • I/O Bandwidth saturation, Link/Pipe Saturation
  • Host CPU Saturation
  • Guest Level Driver and Queuing Interactions
  • Incorrectly Tuned Applications

Methods of determining Performance Requirements

There are various tools which can give us insight into how our applications are performing on a virtual infrastructure as listed below

  • vSphere Client Counters
  • esxstop/resxtop
  • vscsistats
  • Iometer
  • I/O Analyzer (VMware Fling)

vSphere Client Counters

The most significant counters to monitor for disk performance are

  • Disk Throughput (Disk Read Rate/Disk Write rate/Disk Usage) Monitored per LUN or per Host
  • Disk Latency (Physical Device Write Latency/Physical Device Write Latency no greater than 15ms and Kernel disk Read Latency/Kernel Disk Write Latency no greater than 4ms
  • Number of commands queued
  • Number of active disk commands
  • Number of aborted disk commands (Disk Command Aborts)

ESXTOP/RESXTOP

The most significant counters to monitor for disk performance are below and can be monitored per HBA

  • READs/s – Number of Disk Reads/s
  • WRITEs/s – Number of Disk Writes/s
  • MBREAD/s – MB read per second
  • MBWRN/s – MB written per second
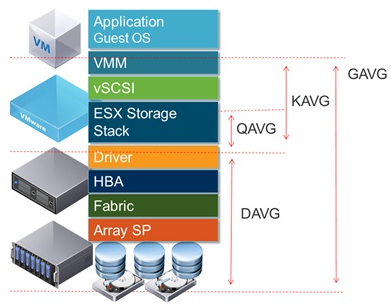
  • GAVG (Guest Average Latency) total latency as seen from vSphere. GAVG is made up of KAVG and DAVG
  • KAVG (Kernel Average Latency) time an I/O request spent waiting inside the vSphere storage stack. Should be close to 0 but anything greater than 2 ms may be a performance problem
  • QAVG (Queue Average latency) time spent waiting in a queue inside the vSphere Storage Stack.
  • DAVG (Device Average Latency) latency coming from the physical hardware, HBA and Storage device. Should be less than 10
  • ACTV – Number of active I/O Operations
  • QUED – I/O operations waiting to be processed. If this is getting into constant double digits then look carefully as the storage hardware cannot keep up with the host
  • ABRTS – A sign of an overloaded system

stroage2

vscsiStats

Since ESX 3.5, VMware has provided a tool specifically for profiling  storage: vscsiStats.  vscsiStats collects and reports counters on  storage activity.  Its data is collected at the virtual SCSI device  level in the kernel.  This means that results are reported per VMDK (or  RDM) irrespective of the underlying storage protocol.  The following  data are reported in histogram form:

  • IO size
  • Seek distance
  • Outstanding IOs
  • Latency (in microseconds)

vscsiStats Command Options

  • -l – Lists running virtual machines and their world (worldGroupID)
  • -s – Starts vscsiStats data collection
  • -x Stops vscsiStats data collection
  • -p – Prints histogram information ( all, ioLength, seekDistance, outstandingIOs, latency, interarrival)
  • -c – Produces results in a comma-delimted list
  • -h – Displays the hep menu for more info
  • seekDistance is the distance in logical block numbers (LBN) that the disk head must travel to read or write a block. If a concentration of your seek distance is very small (less than 1), then the data is sequential in nature. If the seek distance is varied, your level of randomization may be proportional to this distance traveled
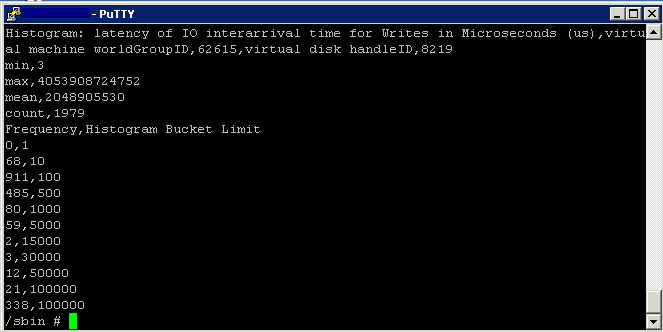
  • interarrival is the amount of time in microseconds between virtual machine disk commands.
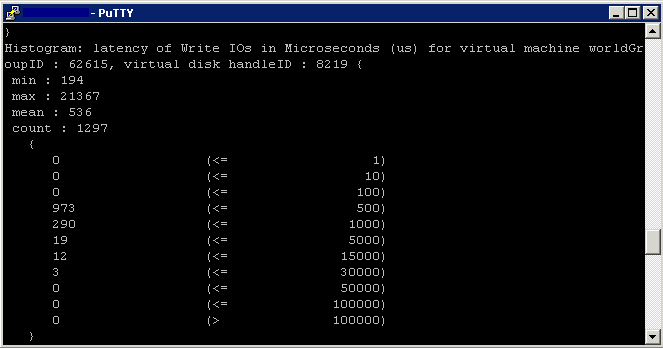
  • latency is the time of the I/O trip.
  • ioLength is the size of the I/O. This is useful when you are trying to determine how to layout your disks or how to optimize the performance of the guest O/S and applications running on the virtual machines.
  • outstandingIOs will give you an idea of any queuing that is occurring.

Instructions

I found vscsiStats in the following locations

/usr/sbin

/usr/lib/vmware/bin

  • Determine the world number for your virtual machine
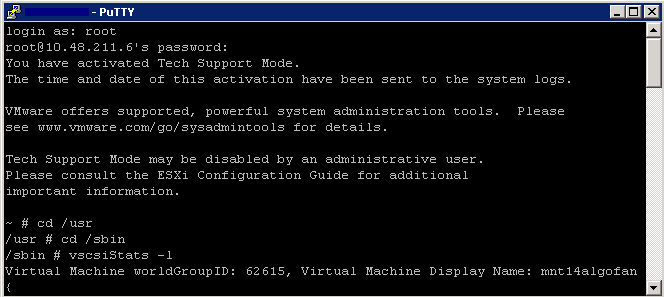
  • Log into an SSH session and type
  • cd /usr
  • cd /sbin
  • vscsiStats -l
  • Record the world ID for the virtual machine you would like to monitor
  • As per example below – 62615

Capture

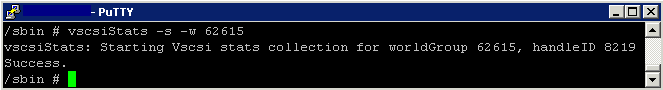
  • Next capture data for your virtual machine
  • vscsiStats -s -w (worldgroup ID)
  • vscsiStats -s – w 62615
  • Although vscsiStats exits, it is still gathering data

putty

  • Once it has started, it will automatically stop after 30 minutes
  • Type the below command to display histograms for all in a comma-delimited list
  • vscsiStats -p all -c
  • You will see many of these histograms listed

putty3

  • Type the following to show the latency histogram
  • vscsiStats -p latency

putty2

  • You can also run vscsiStats and output to a file
  • vscsiStats -p latency > /tmp/vscsioutputfile.txt
  • To manually stop the data collection and reset the counters, type the following command
  • vscsStats -x -w 62615
  • To reset all counters  to zero, run
  • vscsiStats -r

Iometer

What is Iometer?

http://www.electricmonk.org.uk/2012/11/27/iometer/

Iometer is an I/O subsystem measurement and characterization tool for single and clustered systems. It is used as a benchmark and troubleshooting tool and is easily configured to replicate the behaviour of many popular applications. One commonly quoted measurement provided by the tool is IOPS

Iometer can be used for measurement and characterization of:

  • Performance of disk and network controllers.
  • Bandwidth and latency capabilities of buses.
  • Network throughput to attached drives.
  • Shared bus performance.
  • System-level hard drive performance.
  • System-level network performance.

I/O Analyzer (VMware Fling)

http://labs.vmware.com/flings/io-analyzer

VMware I/O Analyzer is a virtual appliance solution, which provides a simple and standardized way of measuring storage performance in VMware vSphere virtualized environments. I/O Analyzer supports two types of workload generator: IOmeter for synthetic workload and trace replay for real-world application workload. It collects both guest level statistics as well as the host level statistics via VMware VI SDK. Standardizing load generation and stats collection increases the confidence of the customer and VMware engineers in the data collected. It also ensures completeness of data collected

Determine use cases for and configure VMware DirectPath I/O

pci

DirectPath I/O allows virtual machine access to physical PCI functions on platforms with an I/O Memory Management Unit.

The following features are unavailable for virtual machines configured with DirectPath

  • Hot adding and removing of virtual devices
  • Suspend and resume
  • Record and replay
  • Fault tolerance
  • High availability
  • DRS (limited availability. The virtual machine can be part of a cluster, but cannot migrate across hosts)
  •  Snapshots

Cisco Unified Computing Systems (UCS) through Cisco Virtual Machine Fabric Extender (VM-FEX) distributed switches support the following features for migration and resource management of virtual machines which use DirectPath I/O

  • Hot adding and removing of virtual devices
  • vMotion
  • Suspend and resume
  • High availability
  • DRS (limited availability
  •  Snapshots

Configure Passthrough Devices on a Host

  • Click on a Host
  • Select the Configuration Tab
  • Under Hardware, select Advanced Settings. You will see a warning message as per below

pass

  • Click Configure Passthrough. The Passthrough Configuration page appears, listing all available passthrough devices.

passthrough

  • A green icon indicates that a device is enabled and active. An orange icon indicates that the state of the device has changed and the host must be rebooted before the device can be used

Capture

Configure a PCI Device on a VM

Prerequisites

Verify that a Passthrough networking device is configured on the host of the virtual machine as per above instructions

Instructions

  • Select a VM
  • Power off the VM
  • From the Inventory menu, select Virtual Machine > Edit Settings
  • On the Hardware tab, click Add.
  • Select PCI Device and click Next
  • Select the Passthrough device to use
  • Click Finish
  • Power on VM

As per below I haven’t cofigured any pass thorugh devices but just to show you where the settings are

vmpci


Storage I/O Control

What is Storage I/ Control?

*VMware Enterprise Plus License Feature

Set an equal baseline and then define priority access to storage resources according to established business rules. Storage I/O Control enables a pre-programmed response to occur when access to a storage resource becomes contentious

With VMware Storage I/O Control, you can configure rules and policies to specify the business priority of each VM. When I/O congestion is detected, Storage I/O Control dynamically allocates the available I/O resources to VMs according to your rules, enabling you to:

  • Improve service levels for critical applications
  • Virtualize more types of workloads, including I/O-intensive business-critical applications
  • Ensure that each cloud tenant gets their fair share of I/O resources
  • Increase administrator productivity by reducing amount of active performance management required.
  • Increase flexibility and agility of your infrastructure by reducing your need for storage volumes dedicated to a single application

How is it configured?

It’s quite straight forward to do. First you have to enable it on the datastores. Only if you want to prioritize a certain VM’s I/Os do you need to do additional configuration steps such as setting shares on a per VM basis. Yes, this can be a bit tedious if you have very many VMs that you want to change from the default shares value. But this only needs to be done once, and after that SIOC is up and running without any additional tweaking needed

The shares mechanism is triggered when the latency to a particular datastore rises above the pre-defined latency threshold seen earlier. Note that the latency is calculated cluster-wide. Storage I/O Control also allows one to tune &  place a maximum on the number of IOPS that a particular VM can generate  to a shared datastore. The Shares and IOPS values are configured on a per VM basis. Edit the Settings of the VM, select the Resource tab, and the Disk setting will allow you to set the Shares value for when contention arises (set to Normal/1000 by default), and limit the IOPs that the VM can generate on the datastore (set to Unlimited by default):

Why enable it?

The thing is, without SIOC, you could definitely hit this noisy neighbour problem where one VM could use more than its fair share of resources and impact other VMs residing on the same datastore. So by simply enabling SIOC on that datastore, the algorithms will ensure fairness across all VMs sharing the same datastore as they will all have the same number of shares by default. This is a great reason for admins to use this feature when it is available to them. And another cool feature is that once SIOC is enabled, there are additional performance counters available to you which you typically don’t have

What threshold should you set?

30ms is an appropriate threshold for most applications however you may want to have a discussion with your storage array vendor, as they often make recommendations around latency threshold values for SIOC

Problems

One reason that this can occur is when the back-end disks/spindles have other LUNs built on them, and these LUNs are presented to non ESXi hosts. Check out

KB 1020651 for details on how to address this and previous posts

and

http://www.electricmonk.org.uk/2012/04/20/external-io-workload-detected-on-shared-datastore-running-storage-io-control-sioc/