
What is the problem which needs to be solved?
It has become a requirement for companies to enable protection of both personal identifiable information and data; including protecting other communications within and across environments New EU General Data Protection Regulations (GDPR) are now a legal requirement for global companies to protect the personal identifiable information of all European Union residents. In the last year, the United Kingdom has left the EU, however the General Data Protection Regulations will still be important to implement. “The Payment Card Industry Data Security Standards (PCI DSS) requires encrypted card numbers. The Health Insurance Portability and Accountability Act and Health Information Technology for Economic and Clinical Health Acts (HIPAA/HITECH) require encryption of Electronic Protected Health Information (ePHI).” (Townsendsecurity, 2019) Little is known about the effect encryption has on the performance of different data held on virtual infrastructure. VM encryption and vSAN encryption are the two data protection options I will evaluate for a better understanding of the functionality and performance effect on software defined storage.
It may be important to understand encryption functionality in order to match business and legal requirements. Certain regulations may need to be met which only specific encryption solutions can provide. Additionally, encryption adds a layer of functionality which is known to have an effect on system performance. With systems which scale into thousands, it is critical to understand what effect encryption will have on functionality and performance in large environments. It will also help when purchasing hardware which has been designed for specific environments to allow some headroom in the specification for the overhead of encryption.
What will be used to test
| Key IT Aspects | Description |
| VMware vSphere ESXi servers | 8 x Dell R640 ESXi servers run the virtual lab environment and the software defined storage. |
| HCIBench test machines | 80 x Linux Photon 1.0 virtual machines. |
| vSAN storage | Virtual datastore combining all 8 ESXi server local NVMe disks. The datastore uses RAID (Redundant array of inexpensive disks), a technique combining multiple disks together for data redundancy and performance. |
| Key Encryption Management Servers | Clustered and load balanced Thales key management servers for encryption key management. |
| Encryption Software | VM encryption and vSAN encryption |
| Benchmarking software | HCIBench v2.3.5 and Oracle Vdbench |
Test lab hardware
8 servers
| Architecture | Details |
| Server Model | Dell R640 1U rackmount |
| CPU Model | Intel Xeon Gold 6148 |
| CPU count | 2 |
| Core count | 20 per CPU |
| Processor AES-NI | Enabled in the BIOS |
| RAM | 768GB (12 x 64GB LRDIMM) |
| NIC | Mellanox ConnectX-4 Lx Dual Port 25GbE rNDC |
| O/S Disk | 1 x 240GB Solid State SATADOM |
| vSAN Data Disk | 3 x 4TB U2 Intel P4510 NVMe |
| vSAN Cache Disk | 1 x 350GB Intel Optane P4800X NVMe |
| Physical switch | Cisco Nexus N9K-C93180YC-EX |
| Physical switch ports | 48 x 25GbE and 4 x 40GbE |
| Virtual switch type | VMware Virtual Distributed Switch |
| Virtual switch port types | Elastic |
HCIBench Test VMs
80 HCIBench Test VMs will be used for this test. I have placed 10 VMs on each of the 8 Dell R640 servers to provide a balanced configuration. No virtual machines other than the HCIBench test VMs will be run on this system to avoid interference with the testing.
The specification of the 80 HCIBench Test VMs are as follows.
| Resources | Details |
| CPU | 4 |
| RAM | 8GB |
| O/S VMDK primary disk | 16GB |
| Data VMDK disk | 20GB |
| Network | 25Gb/s |
HCIBench Performance Metrics
| Workload Parameter | Explanation | Value |
| IOPs | IOPS measures the number of read and write operations per second | Input/Outputs per second |
| Throughput | Throughput measures the number of bits read or written per second Average IO size x IOPS = Throughput in MB/s | MB/s |
| Read Latency | Latency is the response time when you send a small I/O to a storage device. If the I/O is a data read, latency is the time it takes for the data to come back | ms |
| Write Latency | Latency is the response time when you send a small I/O to a storage device. If the I/O is a write, latency is the time for the write acknowledgement to return. | ms |
| Latency Standard Deviation | Standard deviation is a measure of the amount of variation within a set of values. A low standard deviation indicates that the values tend to be close to the mean of the set, while a high standard deviation indicates that the values are spread out over a wider range | Values must be compared to the standard deviation |
| Average ESXi CPU usage | Average ESXi Host CPU usage | % |
| Average vSAN CPU usage | Average CPU use for vSAN traffic only | % |
HCIBench Test Parameter Options
The HCIBench performance options allow you to set the block size and the types of read/write ratios. In these tests, I will be using the following block sizes to give a representation of the different types of applications you can see on corporate systems
- 4k
- 16k
- 64k
- 128k
In these tests I will be using the following Read/Write ratios to also give a representation of the different types of applications you can see on corporate systems
- 0% Read 100% Write
- 20% Read 80% Write
- 70% Read 30% Write
RAID Configuration
- VM encryption will be tested on RAID1 and RAID6 vSAN storage
- vSAN encryption will be tested on RAID1 and RAID6 vSAN storage
Note: vSAN encryption is not configured at all in the policy for vSAN encryption as this is turned on at the datastore level but we still need a generic RAID1 and RAID6 storage policy.
VM encryption RAID1 storage policy
| Test Parameters | Configuration |
| vCenter Storage Policy | Name = raid1_vsan_policy Storage Type = vSAN Failures to tolerate = 1 (RAID 1) Thin provisioned = Yes Number of disk stripes per object = 1 Encryption enabled = Yes Deduplication and Compression enabled = No |
VM encryption RAID6 storage policy
| Test Parameters | Configuration |
| vCenter Storage Policy | Name = raid6_vsan_policy Storage Type = vSAN Failures to tolerate = 2 (RAID6) Thin provisioned = Yes Number of disk stripes per object = 1 Encryption enabled = Yes Deduplication and Compression enabled = No |
vSAN encryption RAID1 storage policy
| Test Parameters | Configuration |
| vCenter Storage Policy | Name = raid1_vsan_policy Storage Type = vSAN Failures to tolerate = 1 (RAID 1) Thin provisioned = Yes Number of disk stripes per object = 1 Deduplication and Compression enabled = No |
vSAN encryption RAID6 storage policy
| Test Parameters | Configuration |
| vCenter Storage Policy | Name = raid6_vsan_policy Storage Type = vSAN Failures to tolerate = 2 (RAID6) Thin provisioned = Yes Number of disk stripes per object = 1 Deduplication and Compression enabled = No |
Test Plans
The table below shows one individual test plan I have created. This plan is replicated for each of the tests listed below. Scroll across at the bottom to see the whole table.
- RAID1 Baseline
- RAID1 VM Encryption
- RAID1 vSAN Encryption
- RAID6 Baseline
- RAID6 VM Encryption
- RAID6 vSAN Encryption
The tests were run for 3 hours each including a warm up and warm down period.
| Test | Number of disks | Working Set % | Number of threads | Block size (k) | Read % | Write % | Random % | Test time (s) |
| 1 | 2 (O/S and Data) | 100% | 1 | 4k | 0 | 100 | 100 | 7200 |
| 2 | 2 (O/S and Data) | 100% | 2 | 4k | 0 | 100 | 100 | 7200 |
| 3 | 2 (O/S and Data) | 100% | 1 | 4k | 20 | 80 | 100 | 7200 |
| 4 | 2 (O/S and Data) | 100% | 2 | 4k | 20 | 80 | 100 | 7200 |
| 5 | 2 (O/S and Data) | 100% | 1 | 4k | 70 | 30 | 100 | 7200 |
| 6 | 2 (O/S and Data) | 100% | 2 | 4k | 70 | 30 | 100 | 7200 |
| 7 | 2 (O/S and Data) | 100% | 1 | 16k | 0 | 100 | 100 | 7200 |
| 8 | 2 (O/S and Data) | 100% | 2 | 16k | 0 | 100 | 100 | 7200 |
| 9 | 2 (O/S and Data) | 100% | 1 | 16k | 20 | 80 | 100 | 7200 |
| 10 | 2 (O/S and Data) | 100% | 2 | 16k | 20 | 80 | 100 | 7200 |
| 11 | 2 (O/S and Data) | 100% | 1 | 16k | 70 | 30 | 100 | 7200 |
| 12 | 2 (O/S and Data) | 100% | 2 | 16k | 70 | 30 | 100 | 7200 |
| 13 | 2 (O/S and Data) | 100% | 1 | 64k | 0 | 100 | 100 | 7200 |
| 14 | 2 (O/S and Data) | 100% | 2 | 64k | 0 | 100 | 100 | 7200 |
| 15 | 2 (O/S and Data) | 100% | 1 | 64k | 20 | 80 | 100 | 7200 |
| 16 | 2 (O/S and Data) | 100% | 2 | 64k | 20 | 80 | 100 | 7200 |
| 17 | 2 (O/S and Data) | 100% | 1 | 64k | 70 | 30 | 100 | 7200 |
| 18 | 2 (O/S and Data) | 100% | 2 | 64k | 70 | 30 | 100 | 7200 |
| 19 | 2 (O/S and Data) | 100% | 1 | 128k | 0 | 100 | 100 | 7200 |
| 20 | 2 (O/S and Data) | 100% | 2 | 128k | 0 | 100 | 100 | 7200 |
| 21 | 2 (O/S and Data) | 100% | 1 | 128k | 20 | 80 | 100 | 7200 |
| 22 | 2 (O/S and Data) | 100% | 2 | 128k | 20 | 80 | 100 | 7200 |
| 23 | 2 (O/S and Data) | 100% | 1 | 128k | 70 | 30 | 100 | 7200 |
| 24 | 2 (O/S and Data) | 100% | 2 | 128k | 70 | 30 | 100 | 7200 |
Results
Click on the graphs for a larger view
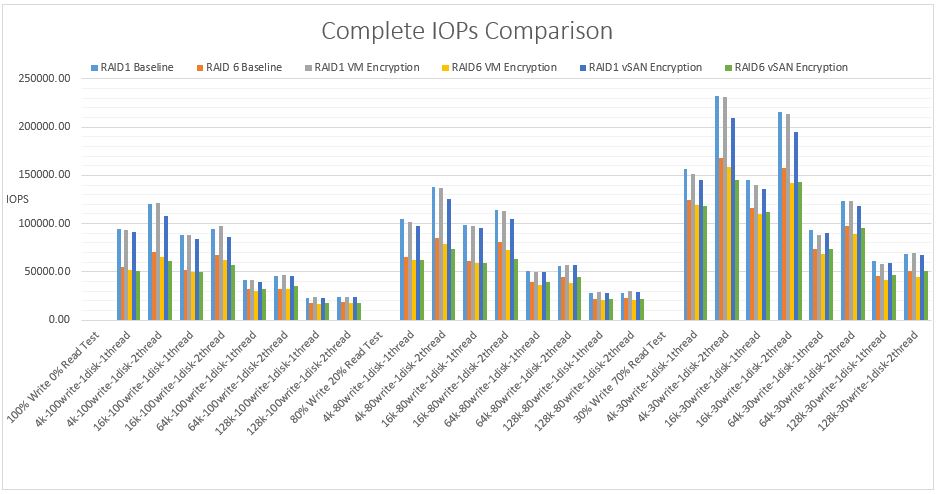
- IOPS comparison for all RAID1 and RAID6 tests
IOPS measures the number of read and write operations per second. The pattern for the 3 different tests is consistent where the heavier write tests show the least IOPs gradually increasing in IOPs as the writes decrease. IOPS and block size tend to have an inverse relationship. As the block size increases, it takes longer latency to read a single block, and therefore the number of IOPS decreases however, smaller block sizes yield higher IOPS.
It is clear to see from the graphs that RAID1 VM encryption and RAID1 vSAN encryption produces more IOPS for all tests than RAID6 VM encryption and RAID6 vSAN encryption. This is expected due to the increased overhead RAID6 incurs over RAID1 in general. RAID 1 results in 2 writes, one to each mirror. A RAID6 single write operation results in 3 reads and 3 writes (due to double parity)
Each write operation requires the disks to read the data, read the first parity, read the second parity, write the data, write the first parity and then finally write the second parity.
RAID1 VM encryption outperforms RAID1 vSAN encryption in terms of IOPs. The RAID6 results are interesting where at the lower block sizes, RAID6 VM encryption outperforms RAID6 vSAN encryption however at the higher block sizes, RAID6 vSAN encryption outperforms VM encryption.
In order of the highest IOPs
- RAID1 VM encryption
- RAID1 vSAN encryption
- RAID6 VM encryption
- RAID 6 vSAN encryption
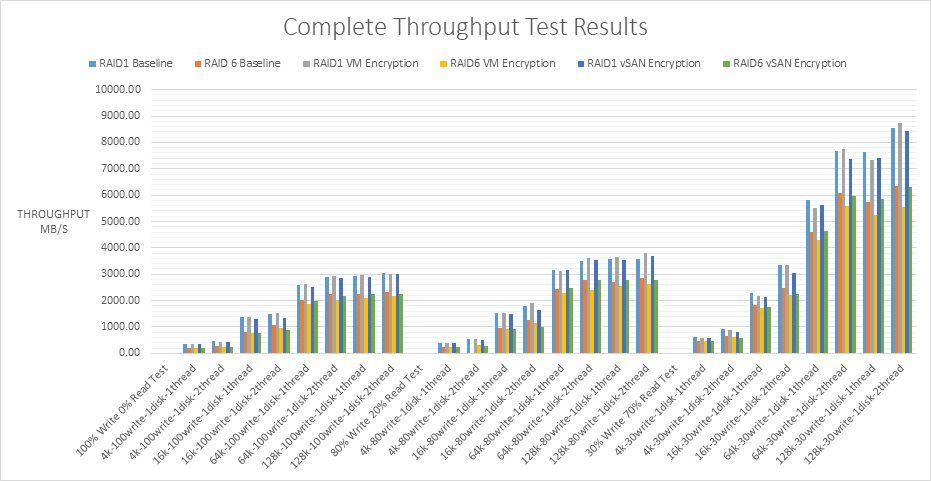
- Throughput comparison for all RAID1 and RAID6 tests
IOPs and throughput are closely related by the following equation.
Throughput (MB/s) = IOPS * Block size
IOPS measures the number of read and write operations per second, while throughput measures the number of bits read or written per second. The higher the throughput, the more data which can be transferred. The graphs follow a consistent pattern from the heavier to the lighter workload tests. I can see the larger block sizes such as 64K and 128K have the greater throughput in each of the workload tests than 4K or 8K. As the block sizes get larger in a workload, the number of IOPS will decrease. Even though it’s fewer IOPS, you’re getting more data throughput because the block sizes are bigger. The vSAN datastore is a native 4K system. It’s important to remember that storage systems may be optimized for different block sizes. It is often the operating system and applications which set the block sizes which then run on the underlying storage. It is important to test different block sizes on storage systems to see the effect these have.
RAID1 VM encryption has the best performance in terms of throughput against RAID1 vSAN encryption however the results are very close together.
RAID6 vSAN encryption has the best performance in terms of throughput against RAID6 VM encryption.
In order of highest throughput
- RAID1 VM encryption
- RAID1 vSAN encryption
- RAID6 vSAN encryption
- RAID6 VM encryption
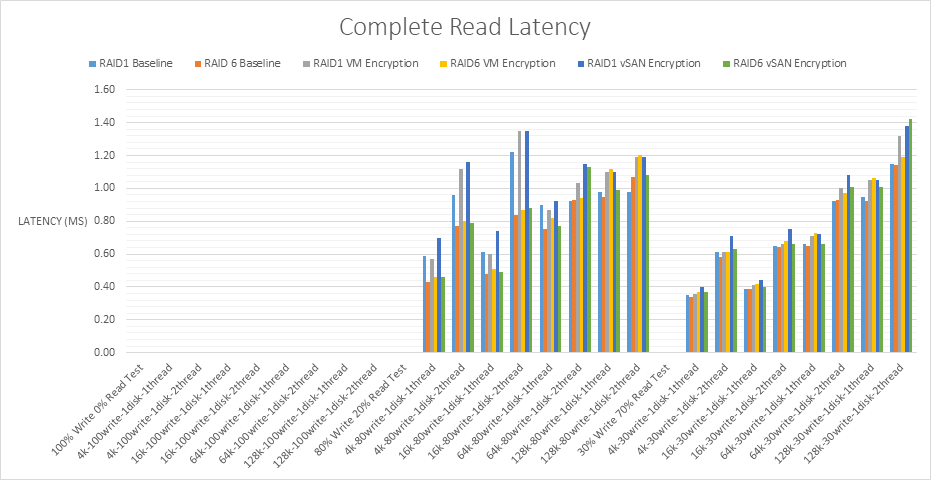
- Read Latency comparison for all RAID1 and RAID6 tests
The pattern is consistent between the read/write workloads. As the workload decreases, read latency decreases although the figures are generally quite close. Read latency for all tests varies between 0.40 and 1.70ms which is under a generally recommended limit of 15ms before latency starts to cause performance problems.
There are outlier values for the Read Latency across RAID1 VM Encryption and RAID1 vSAN encryption at 4K and 16K when testing 2 threads which may be something to note if applications will be used at these block sizes.
RAID1 vSAN encryption incurs a higher read latency in general than RAID1 VM encryption and RAID6 VM encryption incurs a higher read latency in general than RAID6 vSAN encryption however the figures are very close for all figures from the baseline.
RAID6 has more disks than mirrored RAID1 disks to read from than RAID1 therefore the reads are very fast which is reflected in the results. Faster reads result in lower latency.
From the lowest read latency to the highest
- RAID6 vSAN encryption
- RAID6 VM encryption
- RAID1 VM encryption
- RAID1 vSAN encryption
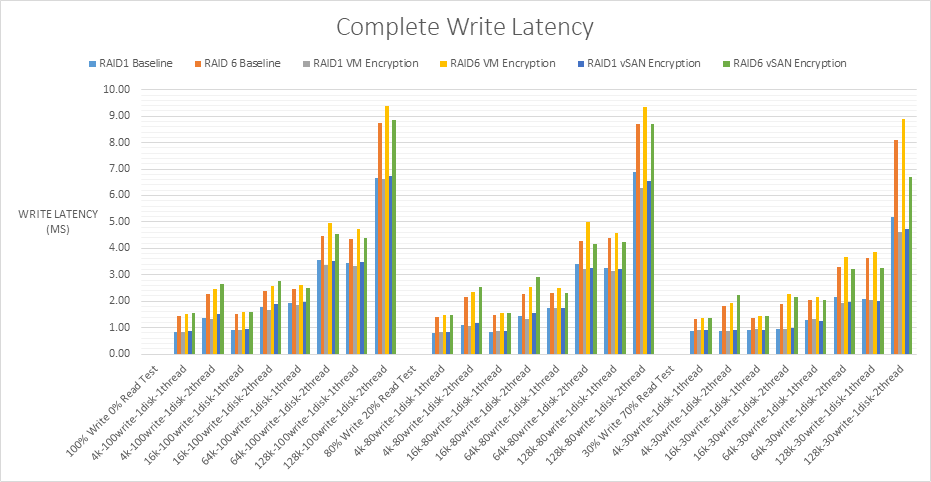
- Write latency comparison for all RAID1 and RAID6 tests
The lowest write latency is 0.8ms and the largest is 9.38ms. Up to 20ms is the recommended value from VMware however with all flash arrays, this should be significantly lower which is what I can see from the results. With NVMe and flash disks, the faster hardware may expose bottlenecks elsewhere in hardware stack and architecture which can be compared with internal VMware host layer monitoring. Write latency can occur at several virtualization layers and filters which each cause their own latency. The layers can be seen below.
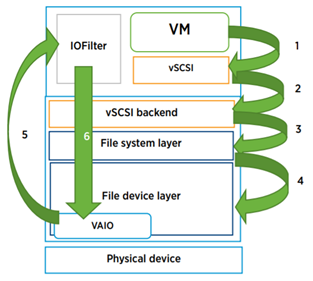
Latency can be caused by limits on the storage controller, queuing at the VMkernel layer, the disk IOPS limit being reached and the types of workloads being run possibly alongside other types of workloads which cause more processing.
The set of tests at the 100% write/0% read and 80% write/20% read have nearly no change in the write latency but it does decrease more significantly for the 30% write/70% read test.
As expected, all the RAID6 results incurred more write latency than the RAID1 results. Each RAID6 write operation requires the disks to read the data, read the first parity, read the second parity, write the data, write the first parity and then finally write the second parity producing a heavy write penalty and therefore more latency.
When split into the RAID1 VM encryption and RAID1 vSAN encryption results, RAID1 VM encryption incurs less write latency than RAID1 vSAN encryption however the values are very close.
When split into the RAID6 VM encryption and RAID6 vSAN encryption results, RAID6 VM encryption seems to perform with less write latency at the lower block sizes however performs with more write latency at the higher block sizes than RAID6 vSAN encryption.
From the lowest write latency to the highest.
- RAID1 VM encryption
- RAID1 vSAN encryption
- RAID6 vSAN encryption
- RAID6 VM encryption
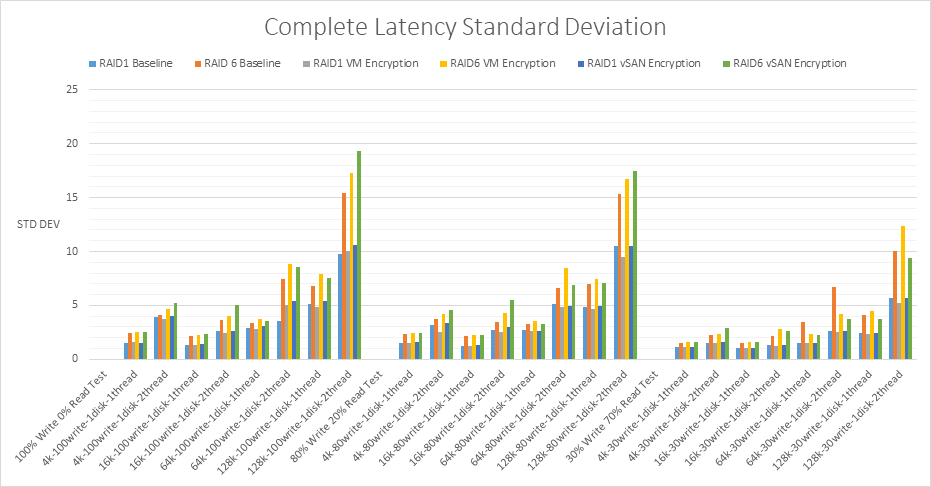
Latency Standard Deviation comparison for all RAID1 and RAID6 tests
The standard deviation value in the testing results uses a 95th percentile. This is explained below with examples.
- An average latency of 2ms and a 95th percentile of 6ms means that 95% of the IO were serviced under 6ms, and that would be a good result
- An average latency of 2ms and a 95th percentile latency of 200ms means 95% of the IO were serviced under 200ms (keeping in mind that some will be higher than 200ms). This means that latencies are unpredictable and some may take a long time to complete. An operation could take less than 2ms, but every once in a while, it could take well over 200
- Assuming a good average latency, it is typical to see the 95th percentile latency no more than 3 times the average latency.
I analysed the results to see if the 95th percentile latency was no more than 3 times the average latency for all tests. I added new columns for multiplying the latency figures for all tests by 3 then comparing this to the standard deviation figure. The formula for these columns was =sum(<relevant_latency_column*3)
In the 80% write, 20% read test for the 64K RAID1 Baseline there was one result which was more than 3 times the average latency however not by a significant amount. In the 30% write, 70% read test for the 64K RAID6 Baseline, there were two results which were more than 3 times the average latency however not by a significant amount.
For all the RAID1 and RAID6 VM encryption and vSAN encryption tests, all standard deviation results overall were less than 3 times the average latency indicating that potentially, AES-NI may give encryption a performance enhancement which prevents significant latency deviations.
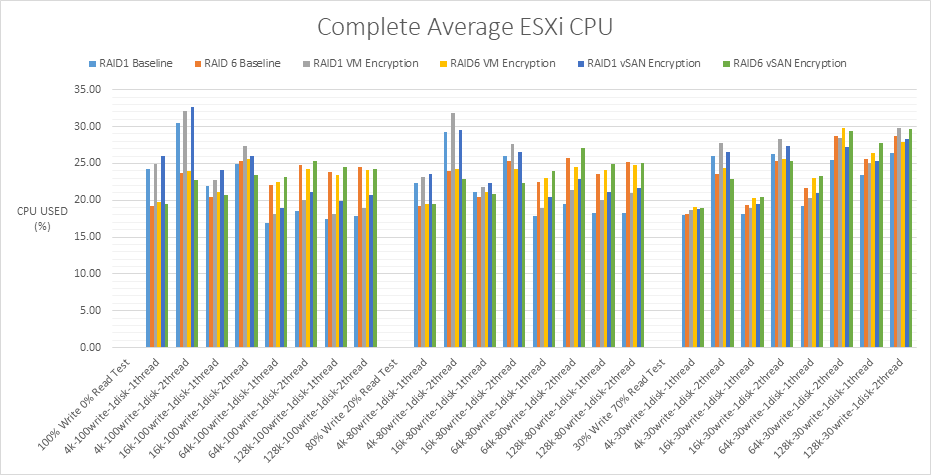
ESXi CPU usage comparison for all RAID1 and RAID6 tests
I used a percentage change formula on the ESXi CPU usage data for all tests. Percentage change differs from percent increase and percent decrease formulas because both directions of the change (Negative or positive) are seen. VMware calculated that using a percentage change formula, that VM encryption added up to 20% overhead to CPU usage (This was for an older vSphere O/S). There are no figures for vSAN encryption from VMware so I have used the same formula for all tests. I used the formula below to calculate the percentage change for all tests.
% change = 100 x (test value – baseline value)/baseline value
The lowest percentage change is -7.73% and the highest percentage change is 18.37% so the tests are all within VMware’s recommendation that encryption can add up to 20% more server CPU usage. Interestingly when the figures are negative, it shows an improvement over the baseline. This could be due to the way AES-NI boosts performance when encryption is enabled. RAID6 VM Encryption and vSAN encryption show more results which outperformed the baseline in these tests than RAID1 VM Encryption and vSAN encryption.
What is interesting about the RAID1 vSAN encryption and RAID6 vSAN encryption figures is that RAID1 vSAN encryption CPU usage goes up between 1 and 2 threads however RAID6 vSAN encryption CPU usage goes down between 1 and 2 threads.
Overall, there is a definite increase in CPU usage when VM encryption or vSAN encryption is enabled for both RAID1 and RAID6 however from looking at graphs, the impact is minimal even at the higher workloads.
RAID6 VM encryption uses less CPU at the higher block sizes than RAID6 vSAN encryption.
From the lowest ESXi CPU Usage to the highest.
- RAID6 VM encryption
- RAID6 vSAN encryption
- RAID1 VM encryption
- RAID1 vSAN encryption
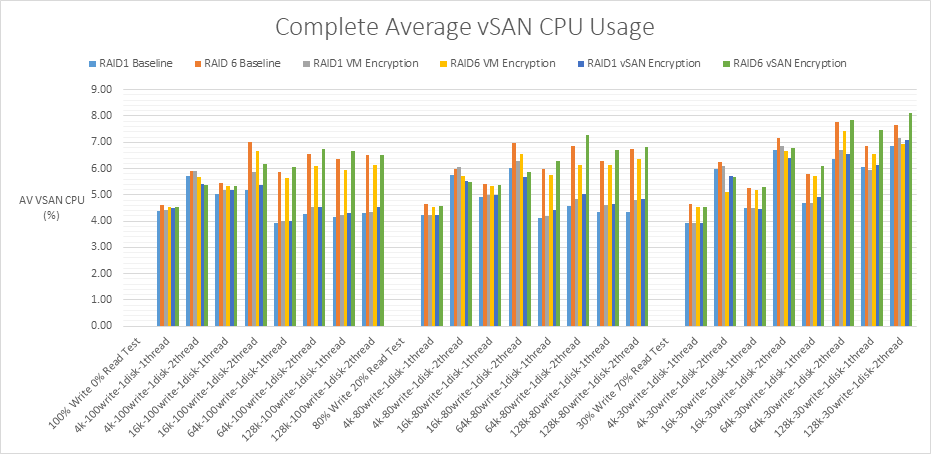
vSAN CPU usage comparison for all RAID1 and RAID6 tests
For the vSAN CPU usage tests. I used a percentage change formula on the data for the vSAN CPU usage comparison tests. Percentage change differs from percent increase and percent decrease formulas because I can see both directions of the change (Negative or positive) Negative values indicate the vSAN CPU usage with encryption performed better than the baseline. VMware calculated that using a percentage change formula, that VM encryption would add up to 20% overhead. There are no figures for vSAN encryption from VMware so I have used the same formula for these tests also.
% change = 100 x (test value – baseline value)/baseline value
The lowest percentage change is -21.88% and the highest percentage change is 12.50% so the tests are all within VMware’s recommendation that encryption in general can add up to 20% more CPU usage. Interestingly when the figures are negative, it shows an improvement over the baseline. This could be due to the way AES-NI boosts performance when encryption is enabled.
RAID1 VM encryption and RAID1 vSAN encryption uses more vSAN CPU than RAID6 VM encryption and RAID6 vSAN encryption. All of the RAID6 VM encryption figures performed better than the RAID6 baseline with the majority of RAID6 vSAN encryption figures performing better than the baseline. In comparison RAID1 VM encryption and RAID1 vSAN encryption nearly always used more CPU than the RAID1 baseline.
From the lowest vSAN CPU usage to the highest.
- RAID6 VM encryption
- RAID6 vSAN encryption
- RAID1 vSAN encryption
- RAID1 VM encryption
Conclusion
The following pages provide a final conclusion on the comparison between the functionality and performance of VM Encryption and vSAN Encryption.
Functionality
The main functionality differences can be summed up as follows
- Storage Policy based (enable per VM)
- Data travels encrypted.
- No deduplication or compression.
- Simple to set up with a key management server.
- The DEK key is stored encrypted in the VMX file/VM advanced settings.
- vSAN and VM encryption use the exact same encryption and kmip libraries but they have very different profiles. VM Encryption is a per-VM encryption.
- VM Encryption utilizes the vCenter server for key management server key transfer. The hosts do not contact the key management server. vCenter only is a licensed key management client reducing license costs.
- Storage agnostic
- Enabled on a virtual cluster datastore level. Encryption is happening at different places in the hypervisor’s layers.
- Data travels unencrypted, but it is written encrypted to the cache layer.
- Full compatibility with deduplication and compression.
- More complicated to set up with a key management server as each vendor has a different way of managing the trust between the key management server the vCenter Server.
- The DEK key is stored encrypted in metadata on each disk.
- vSAN and VM encryption use the exact same libraries but they have very different profiles.
- VM Encryption utilizes the vCenter server for key management server key transfer. The hosts do not contact the key management server. vCenter only is a licensed key management client reducing license costs.
- vSAN only, no other storage is able to be used for vSAN encryption.
Functionality conclusion
VM encryption and vSAN encryption are similar in some functionality. Both use a KMS server, both support RAID1, RAID5 and RAID6 encryption and both use the same encryption libraries and the kmip protocol. However, there are some fundamental differences. VM encryption gives the flexibility of encrypting individual virtual machines on a datastore opposed to encrypting a complete datastore with vSAN encryption where all VMs will automatically be encrypted. Both solutions provide data at rest encryption but only VM encryption provides end to end encryption as it writes an encrypted data stream whereas vSAN encryption receives an unencrypted data stream and encrypts it during the write process. Due to this level at which data is encrypted at, VM encryption cannot be used with features such as deduplication and compression however vSAN encryption can. It depends if this functionality is required and if the space which could be saved was significant. VM encryption is datastore independent and can use vSAN, NAS, FC and iSCSi datastores. vSAN encryption can only be used on virtual machines on a vSAN datastore. Choosing the encryption depends on whether different types of storage reside in the environment and whether they require encryption.
The choice between VM encryption functionality and vSAN encryption functionality will be on a use case dependency of whether individual virtual machine encryption control is required and/or whether there is other storage in an organization targeted for encryption. If this is the case, VM encryption will be best. If these factors are not required and deduplication and compression are required, then vSAN encryption is recommended.
Performance conclusion
The performance tests were designed to get an overall view from a low workload test of 30% Write, 70% Read through a series of increasing workload tests of 80% Write, 20% Read and 100% Write, 0% Read simulation. These tests used different block sizes to simulate different application block sizes. Testing was carried out on an all flash RAID1 and RAID6 vSAN datastore to compare the performance for VM encryption and vSAN encryption. The environment was set up to vendor best practice across vSphere ESXi, vSAN, vCenter and the Dell server configuration.
It can be seen in all these tests that performance is affected by the below factors.
- Block size.
- Workload ratios.
- RAID level.
- Threads used
- Application configuration settings.
- Access pattern of the application.
The table below shows a breakdown of the performance but in some cases the results are very close
| Metric | 1st | 2nd | 3rd | 4th |
| IOPs | RAID1 VM encryption | RAID1 vSAN encryption | RAID6 VM encryption | RAID6 vSAN encryption |
| Throughput | RAID1 VM encryption | RAID1 vSAN encryption | RAID6 vSAN encryption | RAID6 VM encryption |
| Read Latency | RAID6 vSAN encryption | RAID6 VM encryption | RAID1 VM encryption | RAID1 vSAN encryption |
| Write Latency | RAID1 VM encryption | RAID1 vSAN encryption | RAID6 vSAN encryption | RAID6 VM encryption |
| Standard Dev | All standard deviation results were less than 3 times the average latency which is recommended with minor outliers | All standard deviation results were less than 3 times the average latency which is recommended with minor outliers | All standard deviation results were less than 3 times the average latency which is recommended with minor outliers | All standard deviation results were less than 3 times the average latency which is recommended with minor outliers |
| ESXi CPU Usage | RAID6 VM encryption | RAID6 vSAN encryption | RAID1 VM encryption | RAID1 vSAN encryption |
| vSAN CPU Usage | RAID6 VM encryption | RAID6 vSAN encryption | RAID1 vSAN encryption | RAID1 VM encryption |
In terms of IOPs, RAID1 VM encryption produces the highest IOPS for all tests. This is expected due to the increased overhead RAID6 incurs over RAID1 in general. RAID 1 results in 2 writes, one to each mirror. A RAID6 single write operation results in 3 reads and 3 writes (due to double parity) causing more latency decreasing the IOPs.
In terms of throughput, RAID1 VM encryption produces the highest throughput for all tests. It is expected that by producing the highest IOPs in the majority of tests would mean it would produce a similar result for the throughput. Depending on whether your environment needs larger IOPs or larger throughput depends on the block sizing. Larger block sizes produce the best throughput due to getting more data through the system in bigger blocks. As the block size increases, it takes longer latency to read a single block, and therefore the number of IOPS decreases however, smaller block sizes yield higher IOPS.
In terms of read latency, RAID6 vSAN encryption performed best in the read latency tests. Read latency for all tests varies between 0.40 and 1.70ms which is under a generally recommended limit of 15ms before latency starts to cause performance problems. RAID6 has more disks than mirrored RAID1 disks to read from than RAID1 therefore the reads are very fast which is reflected in the results. Faster reads result in lower latency. The values overall were very close.
In terms of write latency, RAID1 VM encryption performed best. All the RAID6 results incurred more write latency than the RAID1 results which was to be expected. Each RAID6 write operation requires the disks to read the data, read the first parity, read the second parity, write the data, write the first parity and then finally write the second parity producing a heavy write penalty and therefore more latency. The lowest write latency is 0.8ms and the largest is 9.38ms. Up to 20ms is the recommended value therefore all tests were well within acceptable limits.
The performance of encrypted data also seems to be enhanced by the use of newer flash disks like SSDs and NVME showing latency figures which were within the acceptable values. SSD and NVMe uses a streamlined lightweight protocol compared to SAS, SCSI and AHC protocols while also reducing CPU cycles.
In terms of standard deviation, all standard deviation test results were less than 3 times the average latency which is recommended.
In terms of average ESXi CPU and vSAN CPU usage, RAID6 VM encryption produced the lowest increase in CPU. All encryption appeared to be enhanced by leveraging the AES-NI instructions in Intel and AMD CPU’s. The increase in CPU usage by the hosts and vSAN compared to the baseline for both sets of encryption tests is minimal and within acceptable margins by a considerable amount. In some cases, there was lower CPU use than the baseline possibly due to the AES-NI offload.
Encryption recommendation
Overall RAID1 VM encryption produces the best IOPs, throughput and write latency including the standard deviation metric values for latency being well under the acceptable limits. RAID1 ESXi CPU usage and vSAN CPU usage is higher than RAID6 however the difference is minimal when looking at the graphs especially in some cases where both sets of tests can outperform the baseline across the different block sizes. For applications which need very fast read performance, RAID6 will always be the best option due to having more disks than mirrored RAID1 disks to read from therefore this encryption should be matched to a specific application requirement if reads are a priority.
Reference
(Townsendsecurity, 2019) The Definitive Guide to VMware Encryption and Key Management [Online]. Available at https://info.townsendsecurity.com/vmware-encryption-key-management-definitive-guide (Accessed 19 February 2020)