vRealize Log Insight Management Pack Configuration – vRealize Operations Management Pack
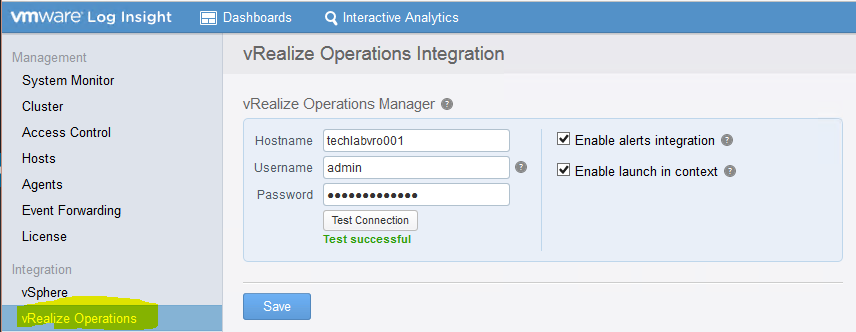
VMware vRealize Operations Manager content pack is provided to present log data in a more meaningful way and to analyze all the logs redirected from a vRealize Operations Manager instance(s). The content pack contains various dashboards, queries and alerts to provide better diagnostics and troubleshooting capabilities to the vRealize Operations Manager administrator
The content pack for vRealize Configurations Manager can be used to aggregate and analyze the logs from multiple vRealize Operations Manager instances. Operators can then select the particular vRealize Operations cluster or node for further analysis of the current state of the environment.
What’s New in v 1.6
- Added vRealize operations Telemetry and vRealize operations cassandra Components in the content pack
- Added new dashboard & widgets relevant to 6.1+, with backwards compatibility to 6.0.x
- New Dashboards, alerts and queries
Components
The vRealize Operation Manager content pack comprises of the following components:
- 12 Dashboard Groups
- 81 Dashboard Widgets
- Queries
- Alerts
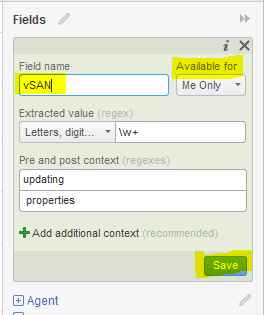
- Extracted Fields
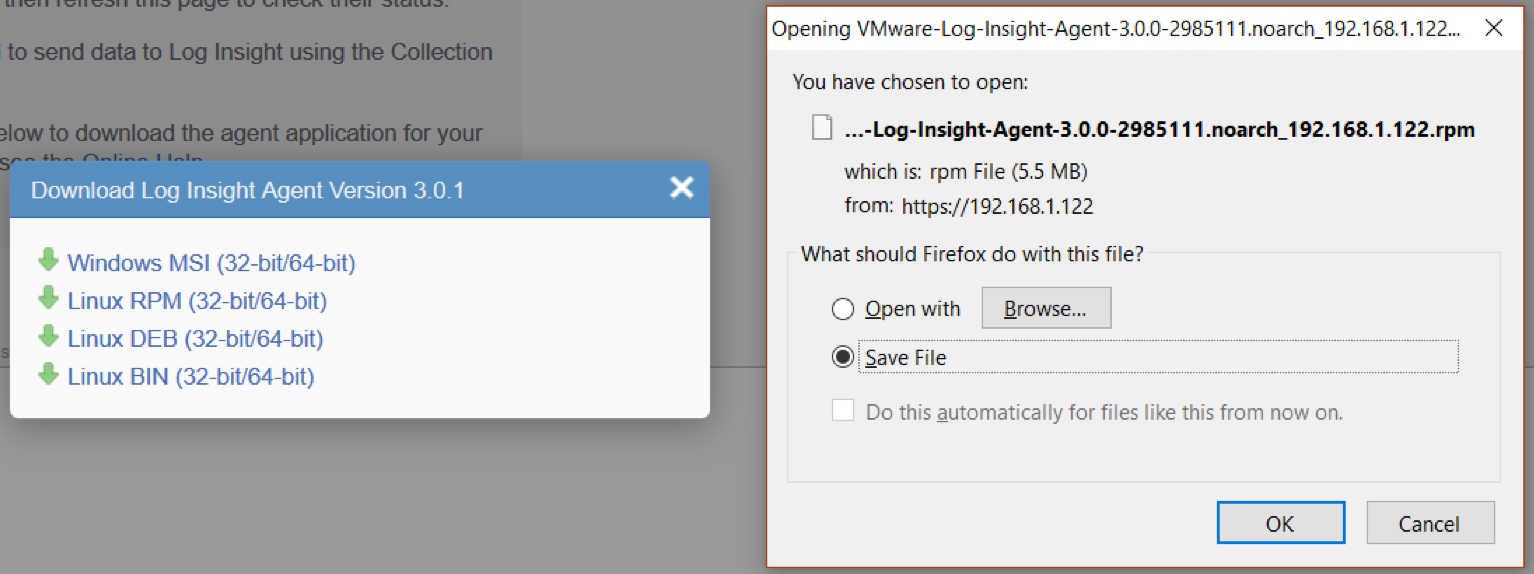
Download Link
The Management Pack can be downloaded here from http://solutionexchange.com
Instructions
- Once you have downloaded the Management Pack and saved it you will need to look at the documentation here
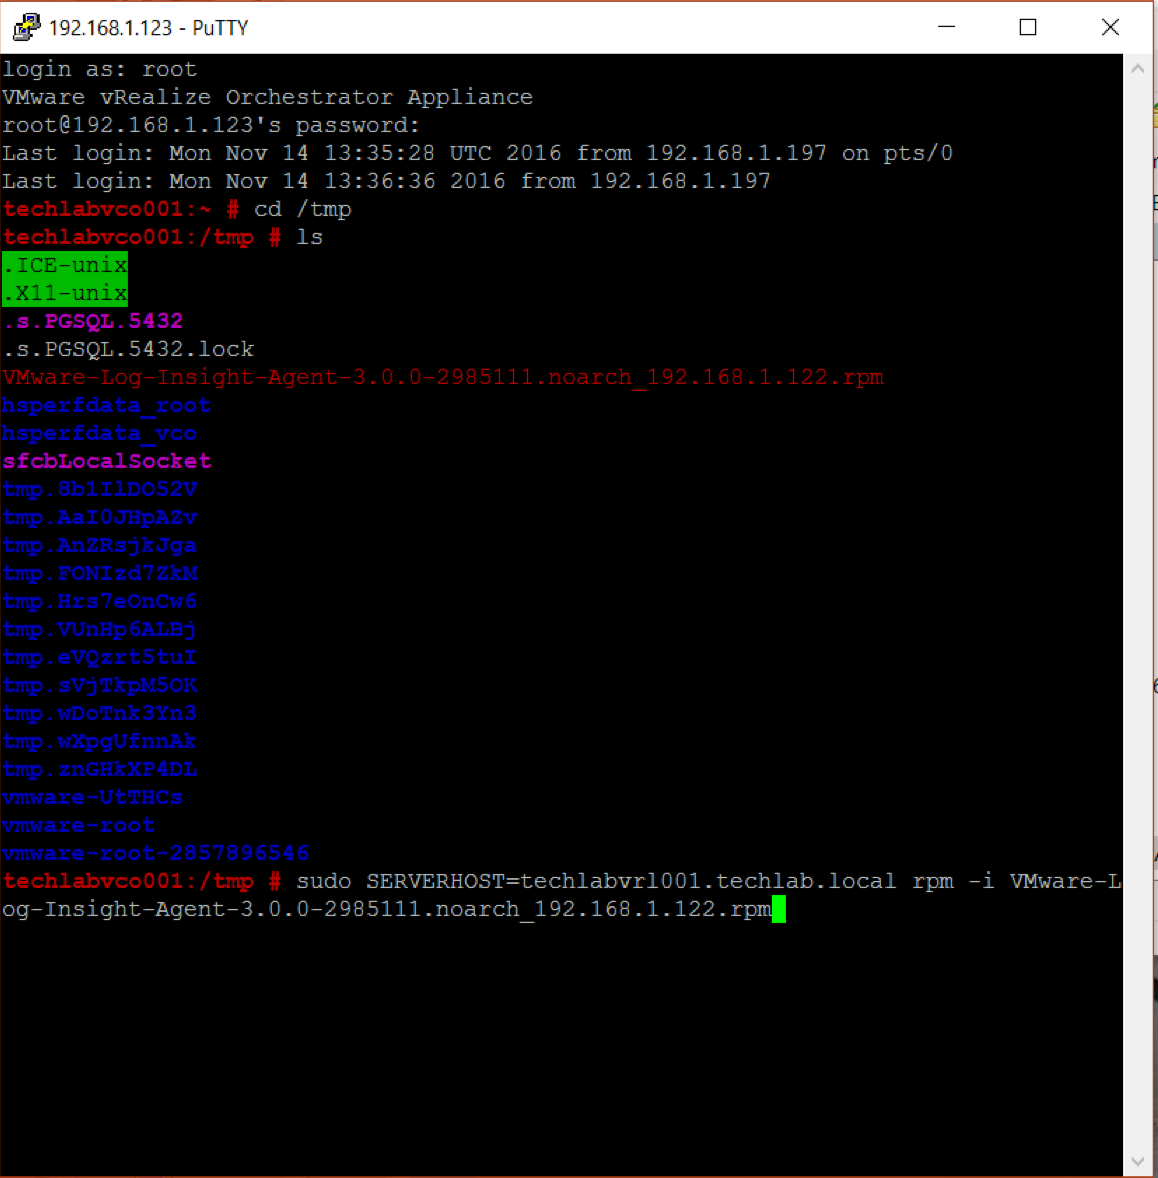
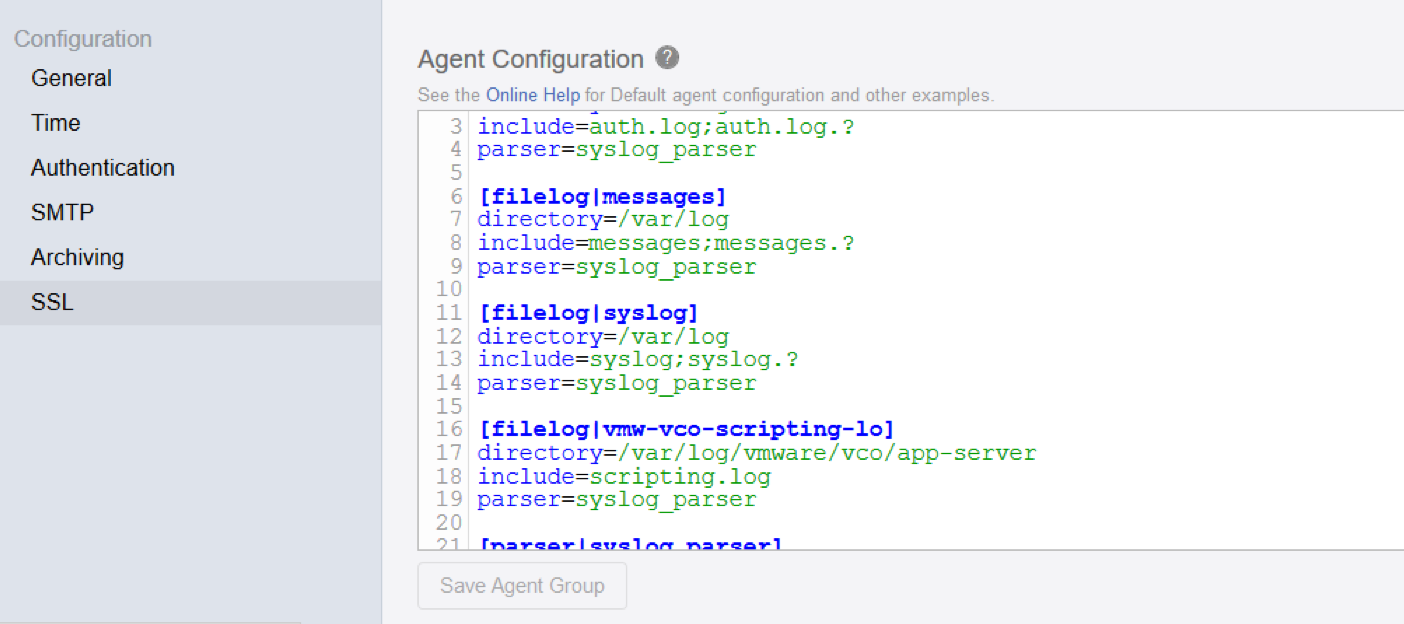
- What we need to do next is modify a file called liagent.ini which is located in /var/lib/loginsight-agent on the vROps appliance
The vRealize Log Insight agent enables the integration and manages communication between vRealize Operations Manager and vRealize Log Insight. The liagent.ini file contains configuration properties that control how the vRealize Log Insight agent sends events to vRealize Log Insight servers, sets the communication protocol and port, and configures flat file log collection.
To identify the source and cluster role, tags need to be updated in the
liagent.ini configuration file. As administrator, configure the following tags for each node role and on each node in the cluster. The applicable values for Cluster roles are the following.
- Master
- Replica
- Data
- RemoteCollector
Within the file below I have highlighted in blue everything which needs adjusting according to the instructions below
- vmw_vr_ops_appname: do not update this tag
- vmw_vr_ops_logtype: do not update this tag
- vmw_vr_ops_clustername: this tag can be updated
- vmw_vr_ops_clusterrole: change the tag to either the Master, Replica, Data, or Remote Collector
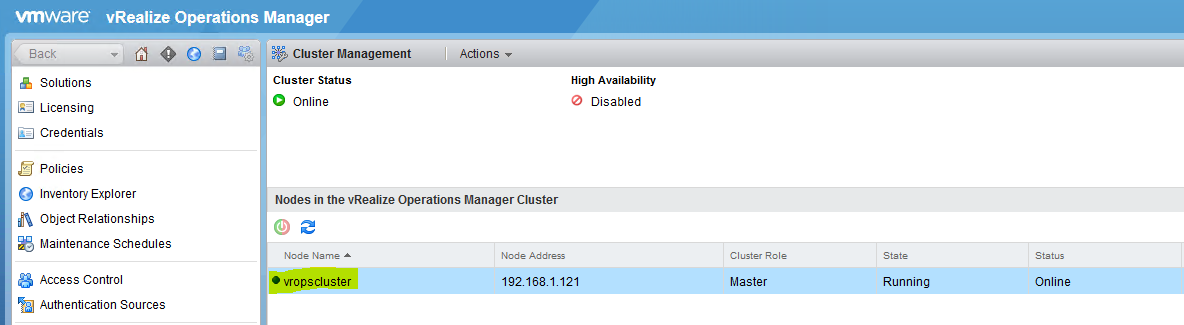
- vmw_vr_ops_nodename: this tag can be updated as per below can be picked up from Administration > Cluster Management in the vROps console
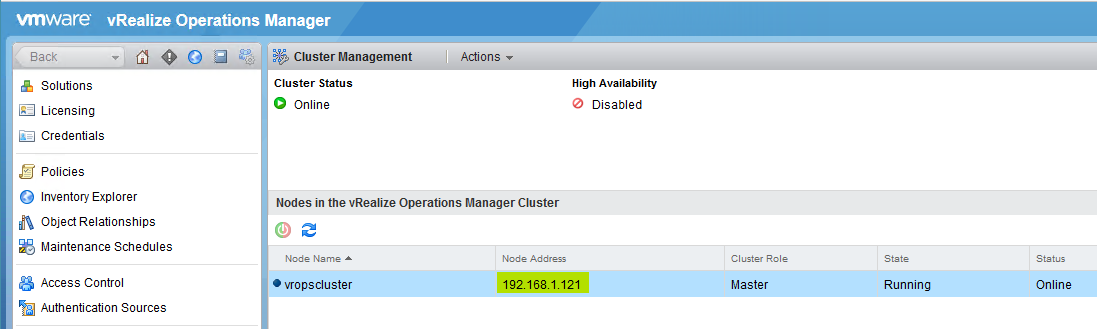
- vmw_vr_ops_hostname: The IP or FQDN of the vRealize Operations Manager node as per below can be picked up from Administration > Cluster Management in the vROps console
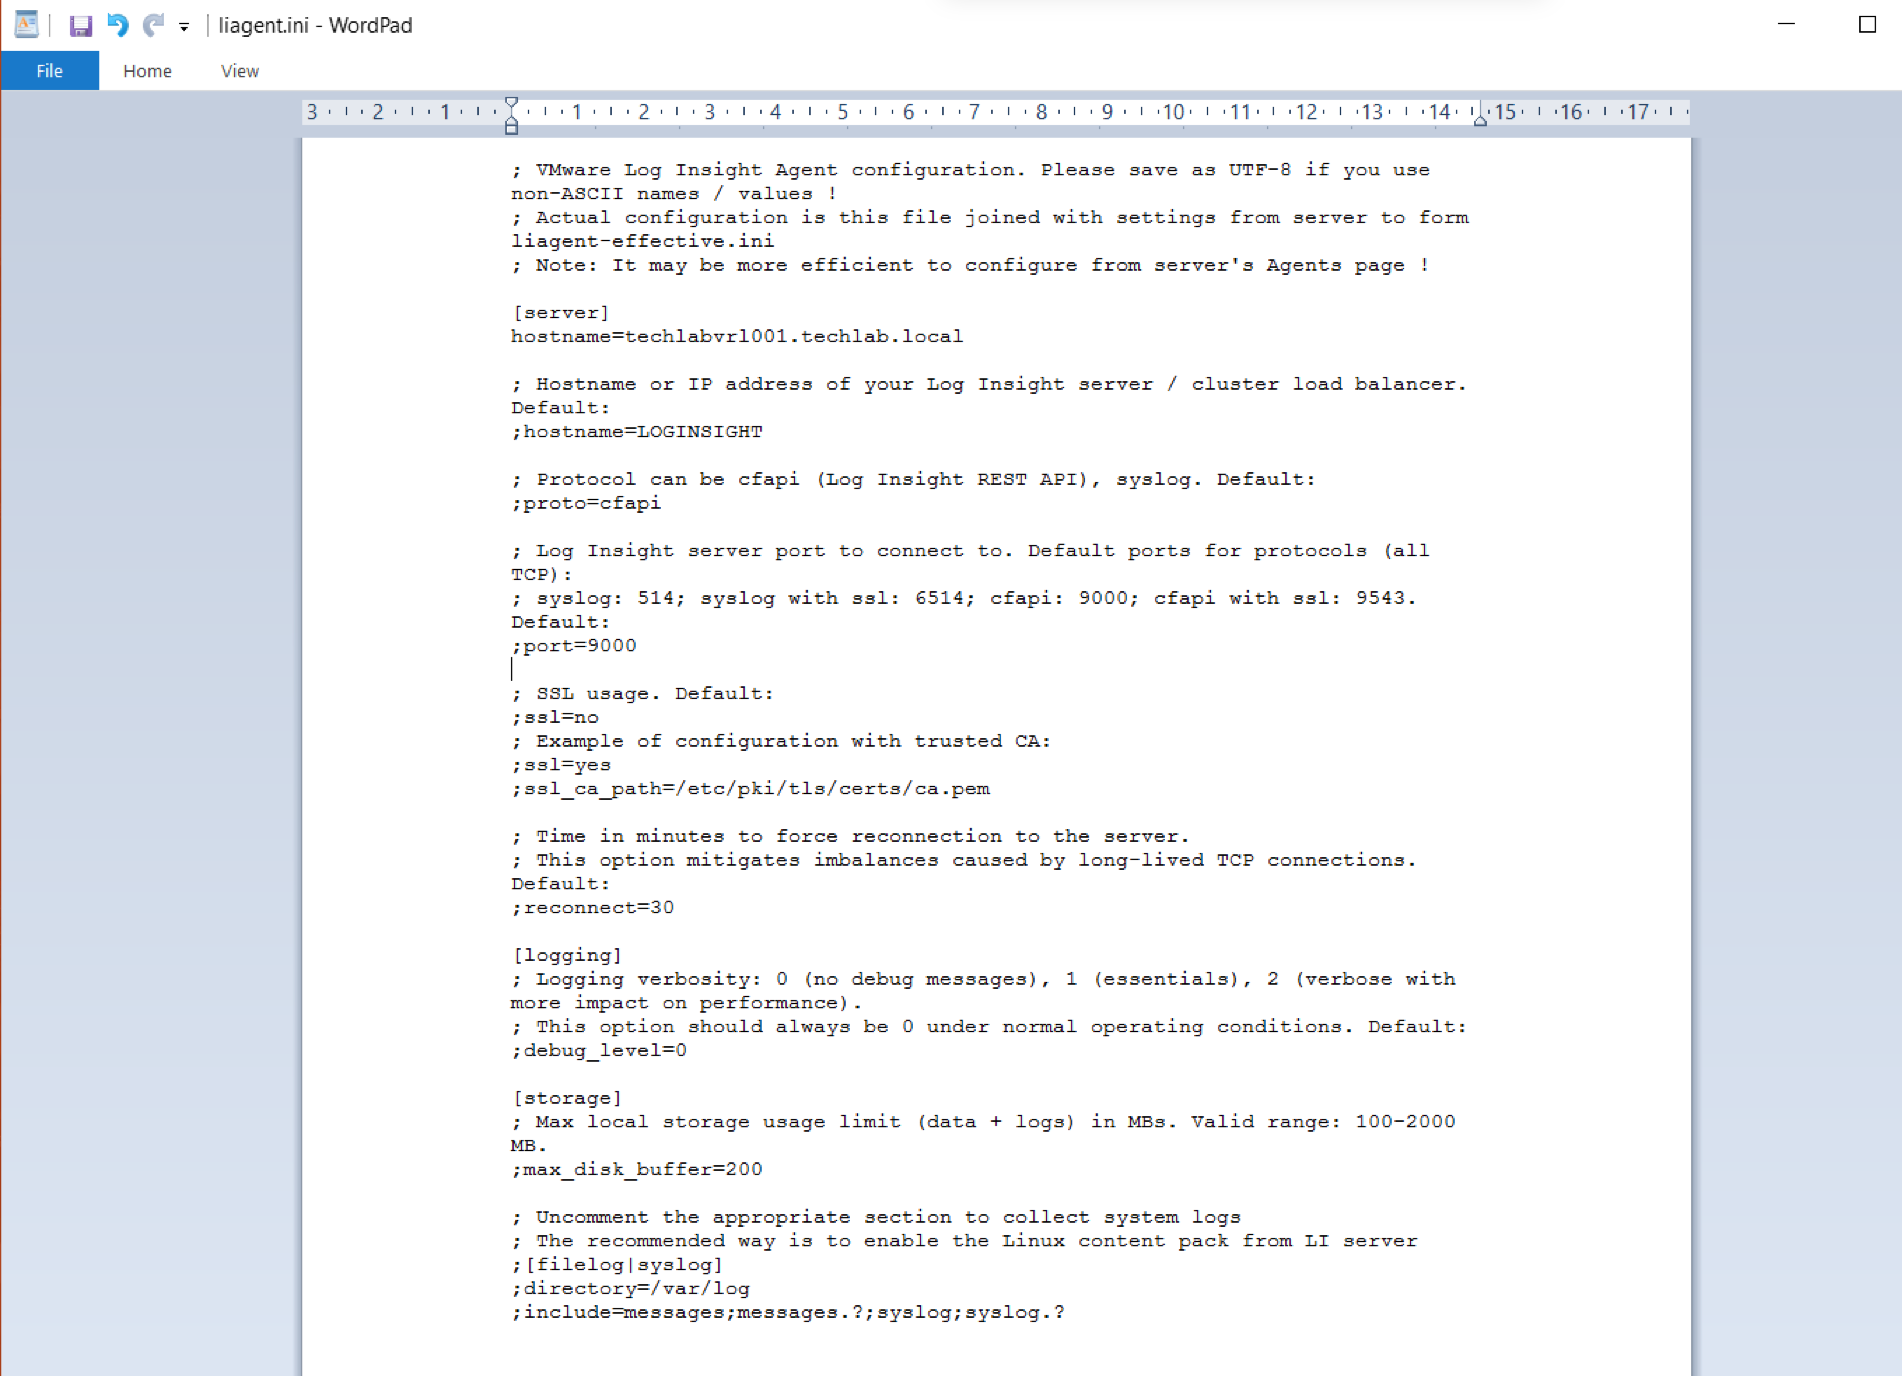
The liagent.ini file
The information below is what is contained in the liagent.ini file
Note you will need to update the [Sever] section only once with the LogInsight Server name
; Client-side configuration of VMware Log Insight Agent
; See liagent-effective.ini for the actual configuration used by VMware Log Insight Agent
[server]
; Log Insight server hostname or ip address
; If omitted the default value is LOGINSIGHT
hostname=techlabvrl001.techlab.local
; Set protocol to use:
; cfapi – Log Insight REST API
; syslog – Syslog protocol
; If omitted the default value is cfapi
;
;proto=cfapi
; Log Insight server port to connect to. If omitted the default value is:
; for syslog: 512
; for cfapi without ssl: 9000
; for cfapi with ssl: 9543
;port=9000
;ssl – enable/disable SSL. Applies to cfapi protocol only.
; Possible values are yes or no. If omitted the default value is no.
;ssl=no
; Time in minutes to force reconnection to the server
; If omitted the default value is 30
;reconnect=30
[storage]
;max_disk_buffer – max disk usage limit (data + logs) in MB:
; 100 – 2000 MB, default 200
;max_disk_buffer=200
[logging]
;debug_level – the level of debug messages to enable:
; 0 – no debug messages
; 1 – trace essential debug messages
; 2 – verbose debug messages (will have negative impact on performace)
;debug_level=0
[filelog|messages]
directory=/var/log
include=messages;messages.?
[filelog|syslog]
directory=/var/log
include=syslog;syslog.?
[filelog|ANALYTICS-analytics]
tags = {“vmw_vr_ops_appname”:”vROps”, “vmw_vr_ops_logtype”:”ANALYTICS”,”vmw_vr_ops_clustername”:”vropscluster“, “vmw_vr_ops_clusterrole”:”Master“,”vmw_vr_ops_nodename”:”vropscluster“, “vmw_vr_ops_hostname”:”techlabvro001.techlab.local“}
directory = /data/vcops/log
include = analytics*.log*
exclude_fields=hostname
[filelog|COLLECTOR-collector]
tags = {“vmw_vr_ops_appname”:”vROps”, “vmw_vr_ops_logtype”:”COLLECTOR”,”vmw_vr_ops_clustername”:”vropscluster“, “vmw_vr_ops_clusterrole”:”Master“,”vmw_vr_ops_nodename”:”vropscluster“, “vmw_vr_ops_hostname”:”techlabvro001.techlab.local“}
directory = /data/vcops/log
include = collector.log*
exclude_fields=hostname
event_marker=^\d{4}-\d{2}-\d{2}[\s]\d{2}:\d{2}:\d{2}\,\d{3}
[filelog|COLLECTOR-collector_wrapper]
tags = {“vmw_vr_ops_appname”:”vROps”, “vmw_vr_ops_logtype”:”COLLECTOR”,”vmw_vr_ops_clustername”:”vropscluster“, “vmw_vr_ops_clusterrole”:”Master“,”vmw_vr_ops_nodename”:”vropscluster“, “vmw_vr_ops_hostname”:”techlabvro001.techlab.local“}
directory = /data/vcops/log
include = collector-wrapper.log*
exclude_fields=hostname
event_marker=^\d{4}-\d{2}-\d{2}[\s]\d{2}:\d{2}:\d{2}\.\d{3}
[filelog|COLLECTOR-collector_gc]
directory = /data/vcops/log
tags = {“vmw_vr_ops_appname”:”vROps”, “vmw_vr_ops_logtype”:”COLLECTOR”,”vmw_vr_ops_clustername”:”vropscluster“, “vmw_vr_ops_clusterrole”:”Master“,”vmw_vr_ops_nodename”:”vropscluster“, “vmw_vr_ops_hostname”:”techlabvro001.techlab.local“}
include = collector-gc*.log*
exclude_fields=hostname
event_marker=^\d{4}-\d{2}-\d{2}[\w]\d{2}:\d{2}:\d{2}\.\d{3}
[filelog|WEB-web]
directory = /data/vcops/log
tags = {“vmw_vr_ops_appname”:”vROps”, “vmw_vr_ops_logtype”:”WEB”,”vmw_vr_ops_clustername”:”vropscluster“, “vmw_vr_ops_clusterrole”:”Master“,”vmw_vr_ops_nodename”:”vropscluster“, “vmw_vr_ops_hostname”:”techlabvro001.techlab.local“}
include = web*.log*
exclude_fields=hostname
event_marker=^\d{4}-\d{2}-\d{2}[\s]\d{2}:\d{2}:\d{2}\,\d{3}
[filelog|GEMFIRE-gemfire]
tags = {“vmw_vr_ops_appname”:”vROps”, “vmw_vr_ops_logtype”:”GEMFIRE”,”vmw_vr_ops_clustername”:”vropscluster“, “vmw_vr_ops_clusterrole”:”Master“,”vmw_vr_ops_nodename”:”vropscluster“, “vmw_vr_ops_hostname”:”techlabvro001.techlab.local“}
directory = /data/vcops/log
include = gemfire*.log*
exclude_fields=hostname
[filelog|VIEW_BRIDGE-view_bridge]
tags = {“vmw_vr_ops_appname”:”vROps”,”vmw_vr_ops_logtype”:”VIEW_BRIDGE”,”vmw_vr_ops_clustername”:”vropscluster“, “vmw_vr_ops_clusterrole”:”Master“,”vmw_vr_ops_nodename”:”vropscluster“, “vmw_vr_ops_hostname”:”techlabvro001.techlab.local“}
directory = /data/vcops/log
include = view-bridge*.log*
exclude_fields=hostname
event_marker=^\d{4}-\d{2}-\d{2}[\s]\d{2}:\d{2}:\d{2}\,\d{3}
[filelog|VCOPS_BRIDGE-vcops_bridge]
tags = {“vmw_vr_ops_appname”:”vROps”,”vmw_vr_ops_logtype”:”VCOPS_BRIDGE”,”vmw_vr_ops_clustername”:”vropscluster” vmw_vr_ops_clusterrole”:”Master“,”vmw_vr_ops_nodename”:”vropscluster“, “vmw_vr_ops_hostname”:”techlabvro001.techlab.local“}
directory = /data/vcops/log
include = vcops-bridge*.log*
exclude_fields=hostname
event_marker=^\d{4}-\d{2}-\d{2}[\s]\d{2}:\d{2}:\d{2}\,\d{3}
[filelog|SUITEAPI-api]
directory = /data/vcops/log
tags = {“vmw_vr_ops_appname”:”vROps”, “vmw_vr_ops_logtype”:”SUITEAPI”,”vmw_vr_ops_clustername”:”vropscluster“, “vmw_vr_ops_clusterrole”:”Master“,”vmw_vr_ops_nodename”:”vropscluster“, “vmw_vr_ops_hostname”:”techlabvro001.techlab.local“}
include = api.log*;http_api.log*;profiling_api.log*
exclude_fields=hostname
event_marker=^\d{4}-\d{2}-\d{2}[\s]\d{2}:\d{2}:\d{2}\,\d{3}
[filelog|SUITEAPI-suite_api]
directory = /data/vcops/log/suite-api
tags = {“vmw_vr_ops_appname”:”vROps”, “vmw_vr_ops_logtype”:”SUITEAPI”,”vmw_vr_ops_clustername”:”vropscluster“, “vmw_vr_ops_clusterrole”:”Master“,”vmw_vr_ops_nodename”:”vropscluster“, “vmw_vr_ops_hostname”:”techlabvro001.techlab.local“}
include = *.log*
exclude_fields=hostname
event_marker=^\d{2}-\w{3}-\d{4}[\s]\d{2}:\d{2}:\d{2}\.\d{3}
[filelog|ADMIN_UI-admin_ui]
tags = {“vmw_vr_ops_appname”:”vROps”, “vmw_vr_ops_logtype”:”ADMIN_UI”,”vmw_vr_ops_clustername”:”vropscluster“, “vmw_vr_ops_clusterrole”:”Master“,”vmw_vr_ops_nodename”:”vropscluster“, “vmw_vr_ops_hostname”:”techlabvro001.techlab.local“}
directory = /data/vcops/log/casa
include = *.log*;*_log*
exclude_fields=hostname
[filelog|CALL_STACK-call_stack]
tags = {“vmw_vr_ops_appname”:”vROps”,”vmw_vr_ops_logtype”:”CALL_STACK”, “vmw_vr_ops_clustername”:”vropscluster“,”vmw_vr_ops_clusterrole”:”Master“, “vmw_vr_ops_nodename”:”vropscluster“,”vmw_vr_ops_hostname”:”techlabvro001.techlab.local“}
directory = /data/vcops/log/callstack
include = analytics*.txt;collector*.txt
exclude_fields=hostname
[filelog|TOMCAT_WEBAPP-tomcat_webapp]
tags = {“vmw_vr_ops_appname”:”vROps”,”vmw_vr_ops_logtype”:”TOMCAT_WEBAPP”,”vmw_vr_ops_clustername”:”vropscluster“, “vmw_vr_ops_clusterrole”:”Master“,”vmw_vr_ops_nodename”:”vropscluster“, “vmw_vr_ops_hostname”:”techlabvro001.techlab.local“}
directory = /data/vcops/log/product-ui
include = *.log*;*_log*
exclude_fields=hostname
[filelog|OTHER-other1]
tags = {“vmw_vr_ops_appname”:”vROps”, “vmw_vr_ops_logtype”:”OTHER”,”vmw_vr_ops_clustername”:”vropscluster“, “vmw_vr_ops_clusterrole”:”Master“,”vmw_vr_ops_nodename”:”vropscluster“, “vmw_vr_ops_hostname”:”techlabvro001.techlab.local“}
directory = /data/vcops/log
include = aim*.log*;calltracer*.log*;casa.audit*.log*;distributed*.log*;hafailover*.log;his*.log*;installer*.log*;locktrace*.log*;opsapi*.log*;query-service-timer*.log*;queryprofile*.log*;vcopsConfigureRoles*.log*
exclude_fields=hostname
event_marker=^\d{4}-\d{2}-\d{2}[\s]\d{2}:\d{2}:\d{2}\,\d{3}
[filelog|OTHER-other2]
tags = {“vmw_vr_ops_appname”:”vROps”, “vmw_vr_ops_logtype”:”OTHER”, “vmw_vr_ops_clustername”:”vropscluster“, “vmw_vr_ops_clusterrole”:”Master“, “vmw_vr_ops_nodename”:”vropscluster“, “vmw_vr_ops_hostname”:”techlabvro001.techlab.local“}
directory = /data/vcops/log
include = env-checker.log*
exclude_fields=hostname
event_marker=^\d{2}\D{1}\d{2}\D{1}\d{4}\s\d{2}:\d{2}:\d{2}
[filelog|OTHER-other3]
tags = {“vmw_vr_ops_appname”:”vROps”, “vmw_vr_ops_logtype”:”OTHER”, “vmw_vr_ops_clustername”:”vropscluster“, “vmw_vr_ops_clusterrole”:”Master“, “vmw_vr_ops_nodename”:”vropscluster“, “vmw_vr_ops_hostname”:”techlabvro001.techlab.local“}
directory = /data/vcops/log
include = gfsh*.log*;HTTPPostAdapter*.log*;meta-gemfire*.log*;migration*.log*
exclude_fields=hostname
[filelog|OTHER-watchdog]
tags = {“vmw_vr_ops_appname”:”vROps”, “vmw_vr_ops_logtype”:”OTHER”, “vmw_vr_ops_clustername”:”vropscluster“, “vmw_vr_ops_clusterrole”:”Master”, “vmw_vr_ops_nodename”:”vropscluster“, “vmw_vr_ops_hostname”:”techlabvro001.techlab.local“}
directory = /data/vcops/log/vcops-watchdog
include = vcops-watchdog.log*
exclude_fields=hostname
event_marker=^\d{4}-\d{2}-\d{2}[\s]\d{2}:\d{2}:\d{2}\,\d{3}
[filelog|ADAPTER-vmwareadapter]
tags = {“vmw_vr_ops_appname”:”vROps”, “vmw_vr_ops_logtype”:”ADAPTER”, “vmw_vr_ops_clustername”:”vropscluster“, “vmw_vr_ops_clusterrole”:”Master“, “vmw_vr_ops_nodename”:”vropscluster“, “vmw_vr_ops_hostname”:”techlabvro001.techlab.local“}
directory = /data/vcops/log/adapters/VMwareAdapter
include = *.log*
exclude_fields=hostname
event_marker=^\d{4}-\d{2}-\d{2}[\s]\d{2}:\d{2}:\d{2}\,\d{3}
[filelog|ADAPTER-vcopsadapter]
tags = {“vmw_vr_ops_appname”:”vROps”, “vmw_vr_ops_logtype”:”ADAPTER”, “vmw_vr_ops_clustername”:”vropscluster“, “vmw_vr_ops_clusterrole”:”Master“, “vmw_vr_ops_nodename”:”vropscluster“, “vmw_vr_ops_hostname”:”techlabvro001.techlab.local“}
directory = /data/vcops/log/adapters/VCOpsAdapter
include = *.log*
exclude_fields=hostname
event_marker=^\d{4}-\d{2}-\d{2}[\s]\d{2}:\d{2}:\d{2}\,\d{3}
[filelog|ADAPTER-openapiadapter]
tags = {“vmw_vr_ops_appname”:”vROps”, “vmw_vr_ops_logtype”:”ADAPTER”, “vmw_vr_ops_clustername”:”vropscluster“, “vmw_vr_ops_clusterrole”:”Master“, “vmw_vr_ops_nodename”:”vropscluster“, “vmw_vr_ops_hostname”:”techlabvro001.techlab.local“}
directory = /data/vcops/log/adapters/OpenAPIAdapter
include = *.log*
exclude_fields=hostname
event_marker=^\d{4}-\d{2}-\d{2}[\s]\d{2}:\d{2}:\d{2}\,\d{3}
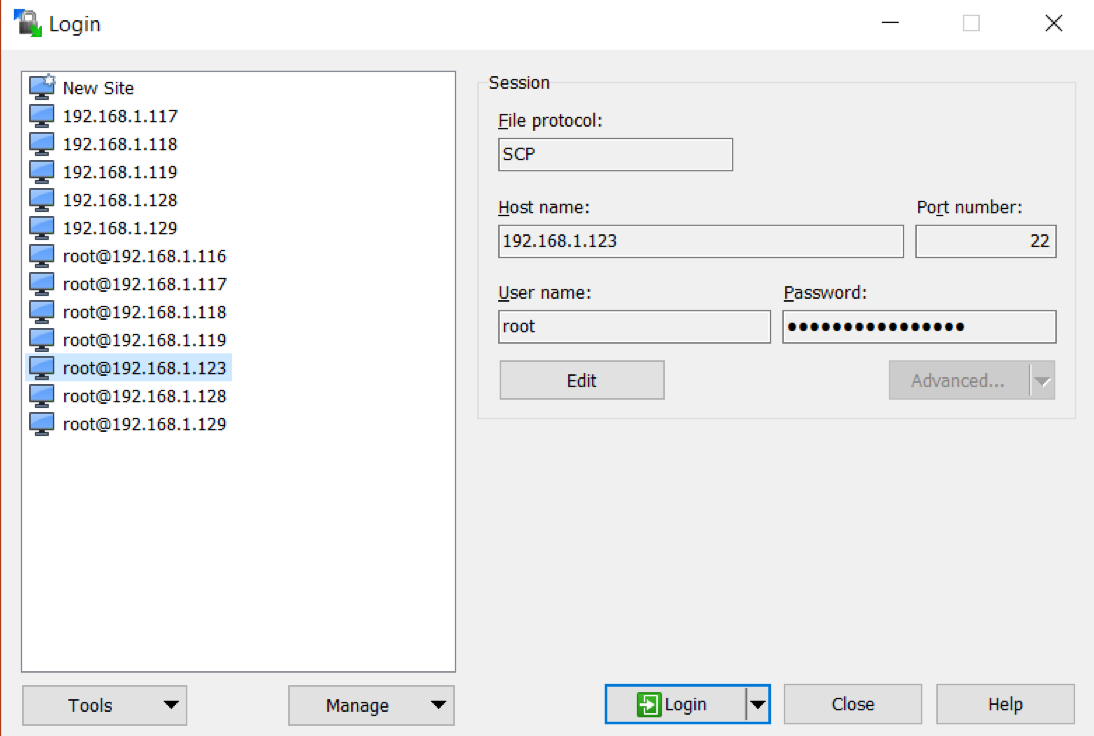
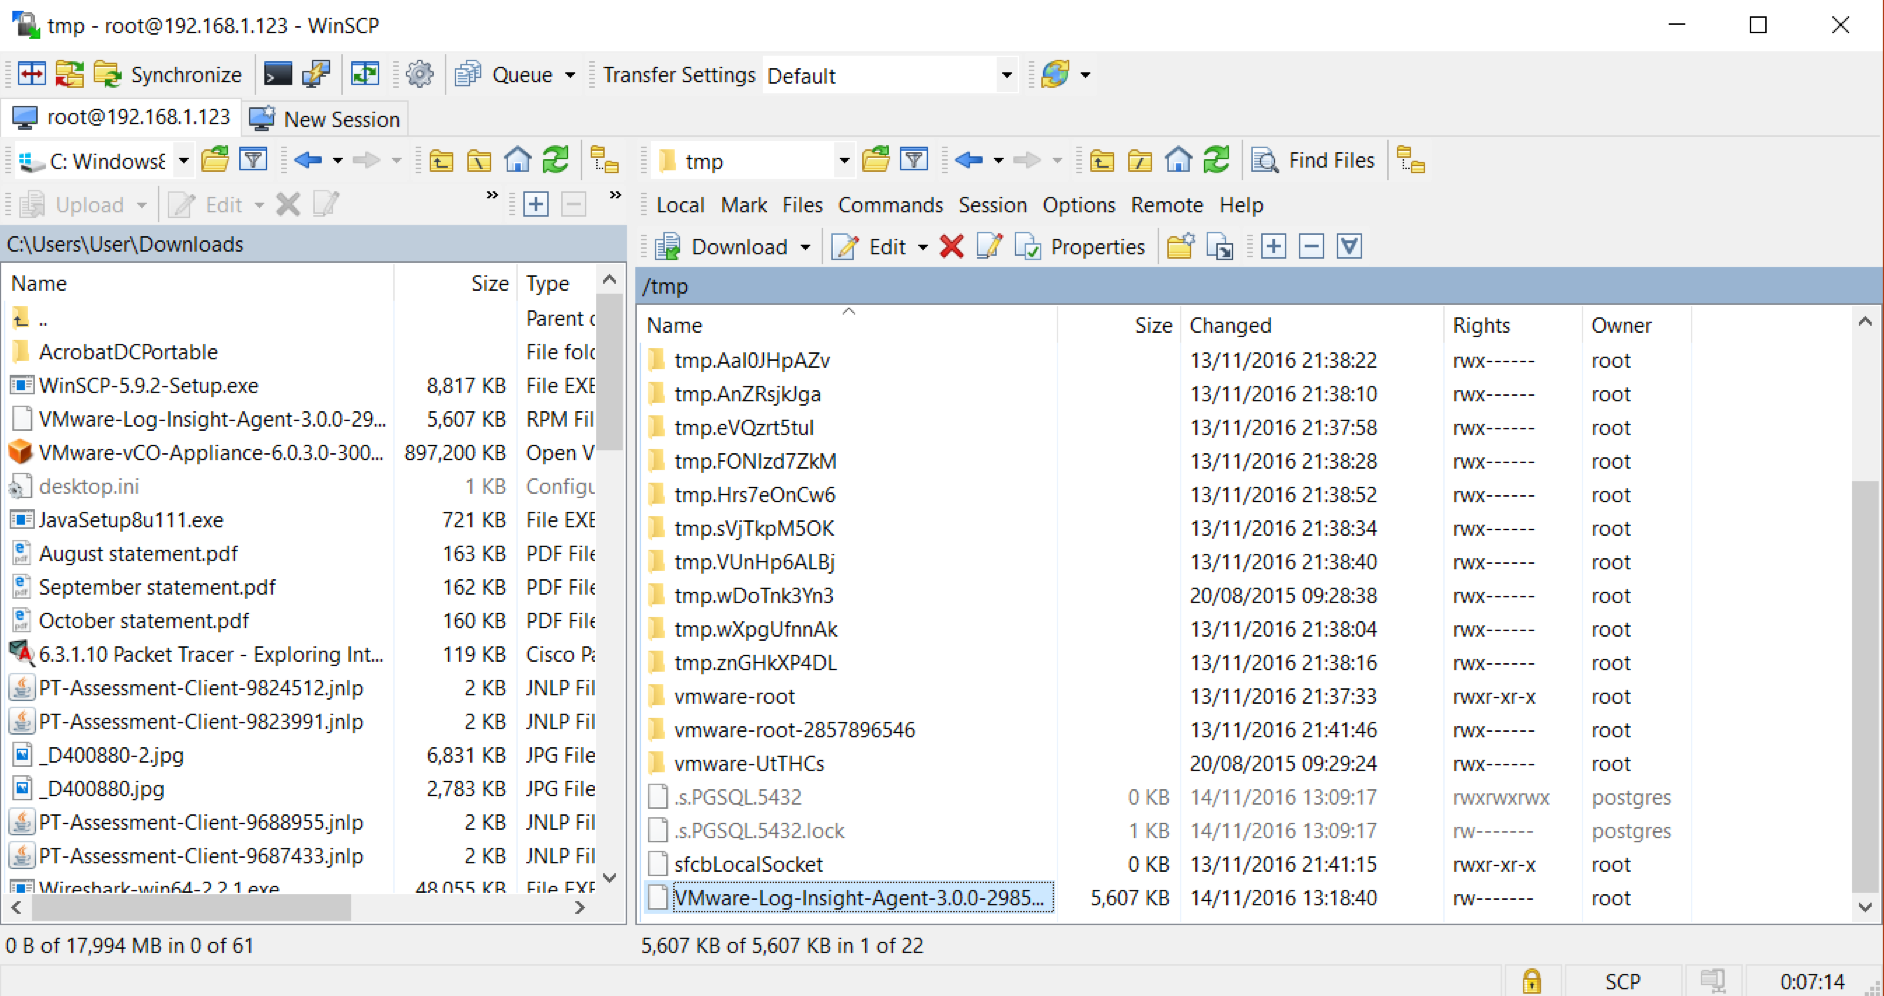
- Next we need to copy this file into the vROps appliance via WinScp into the /var/lib/loginsight-agent folder. Note: Take a backup of the original liagent.ini file first
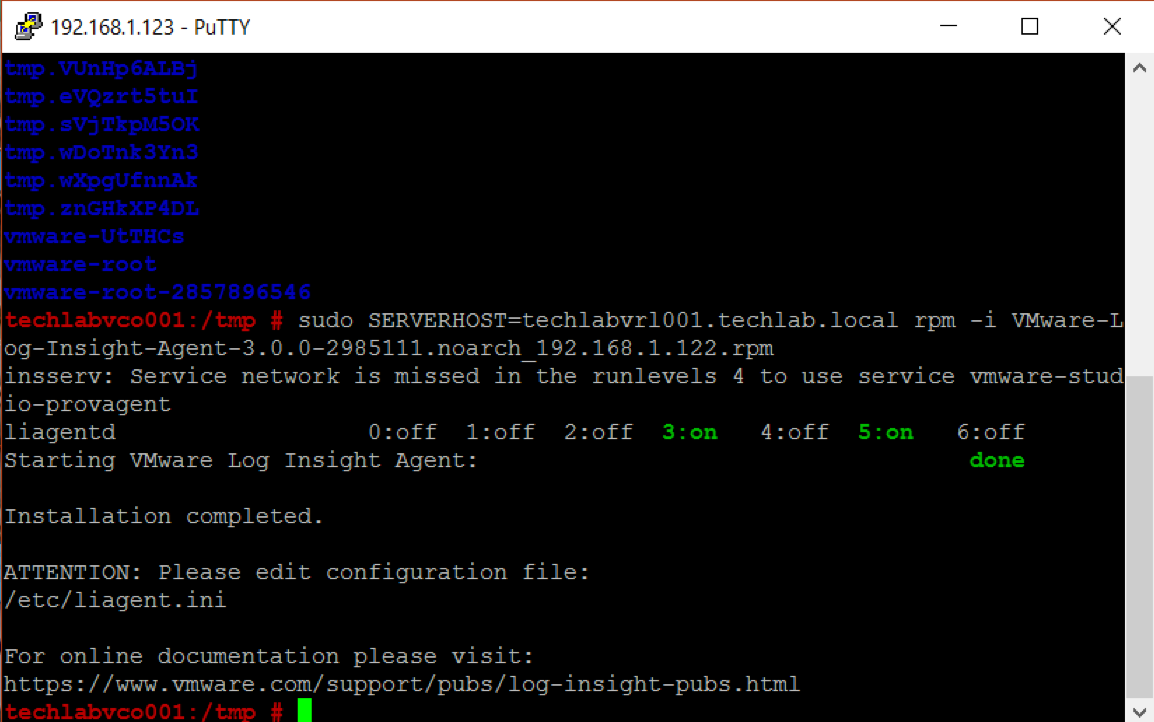
- Next restart the liagentd service in Putty by typing /etc/init.d/liagentd restart
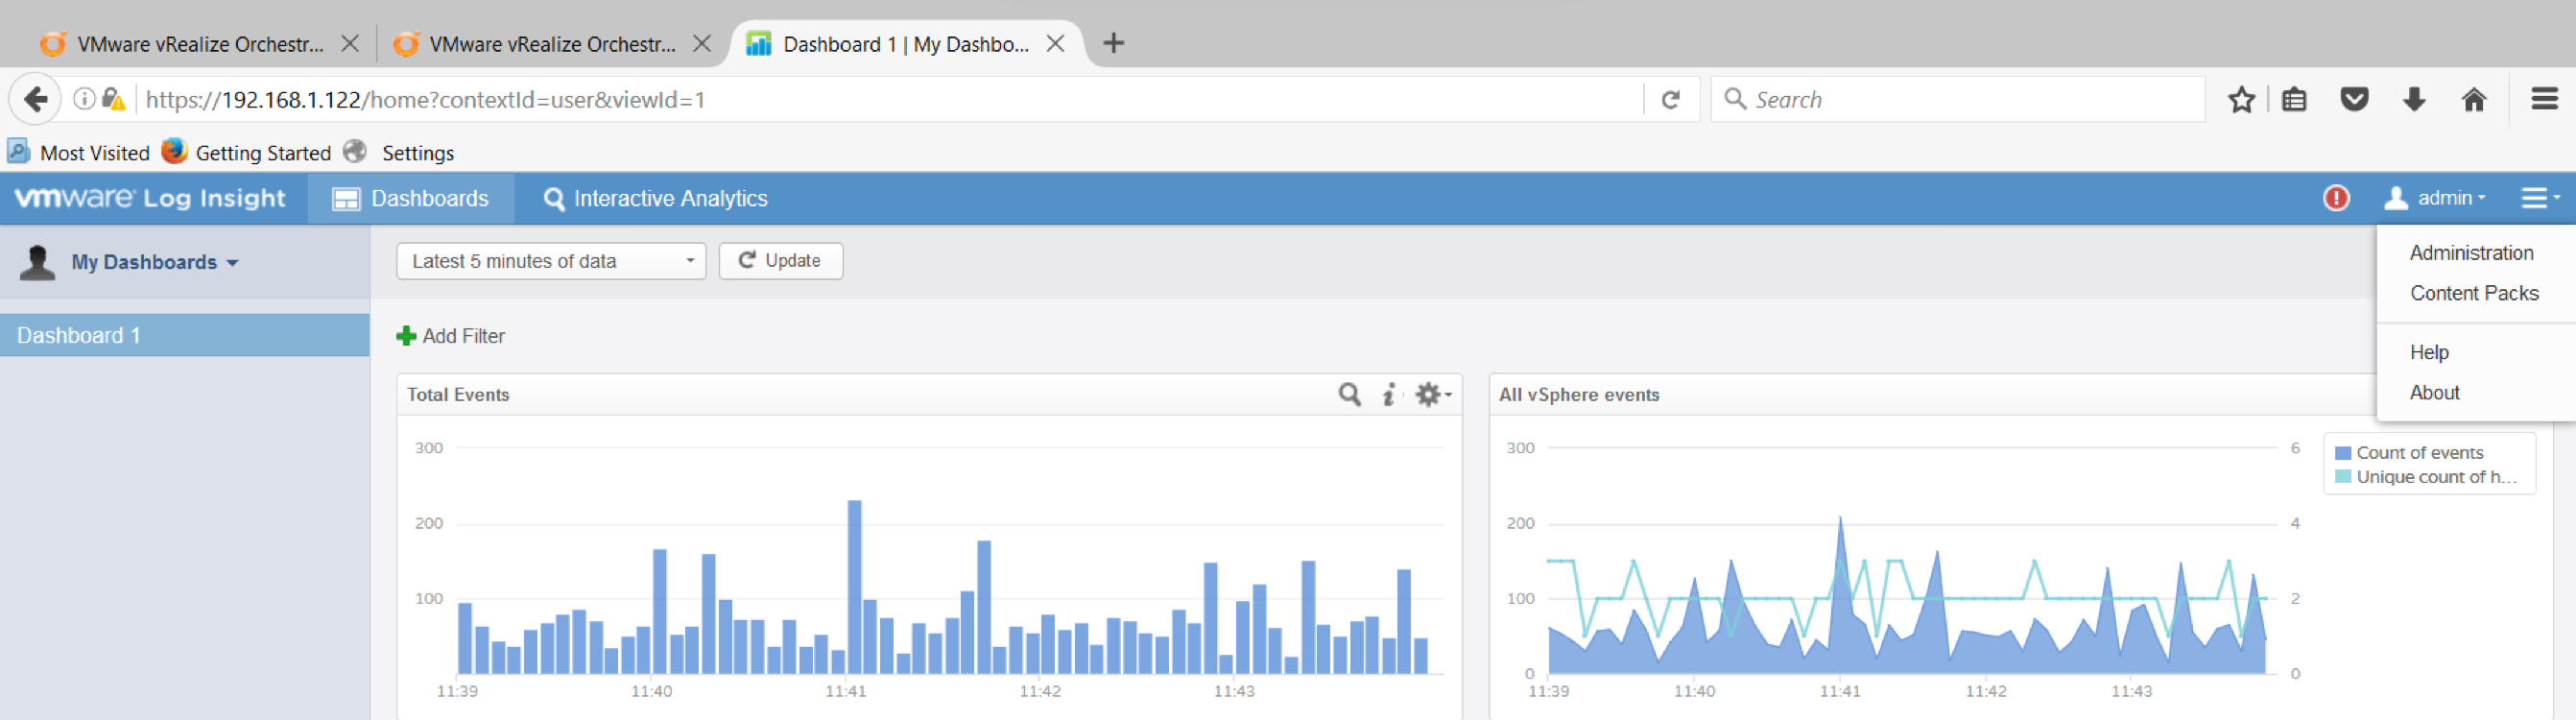
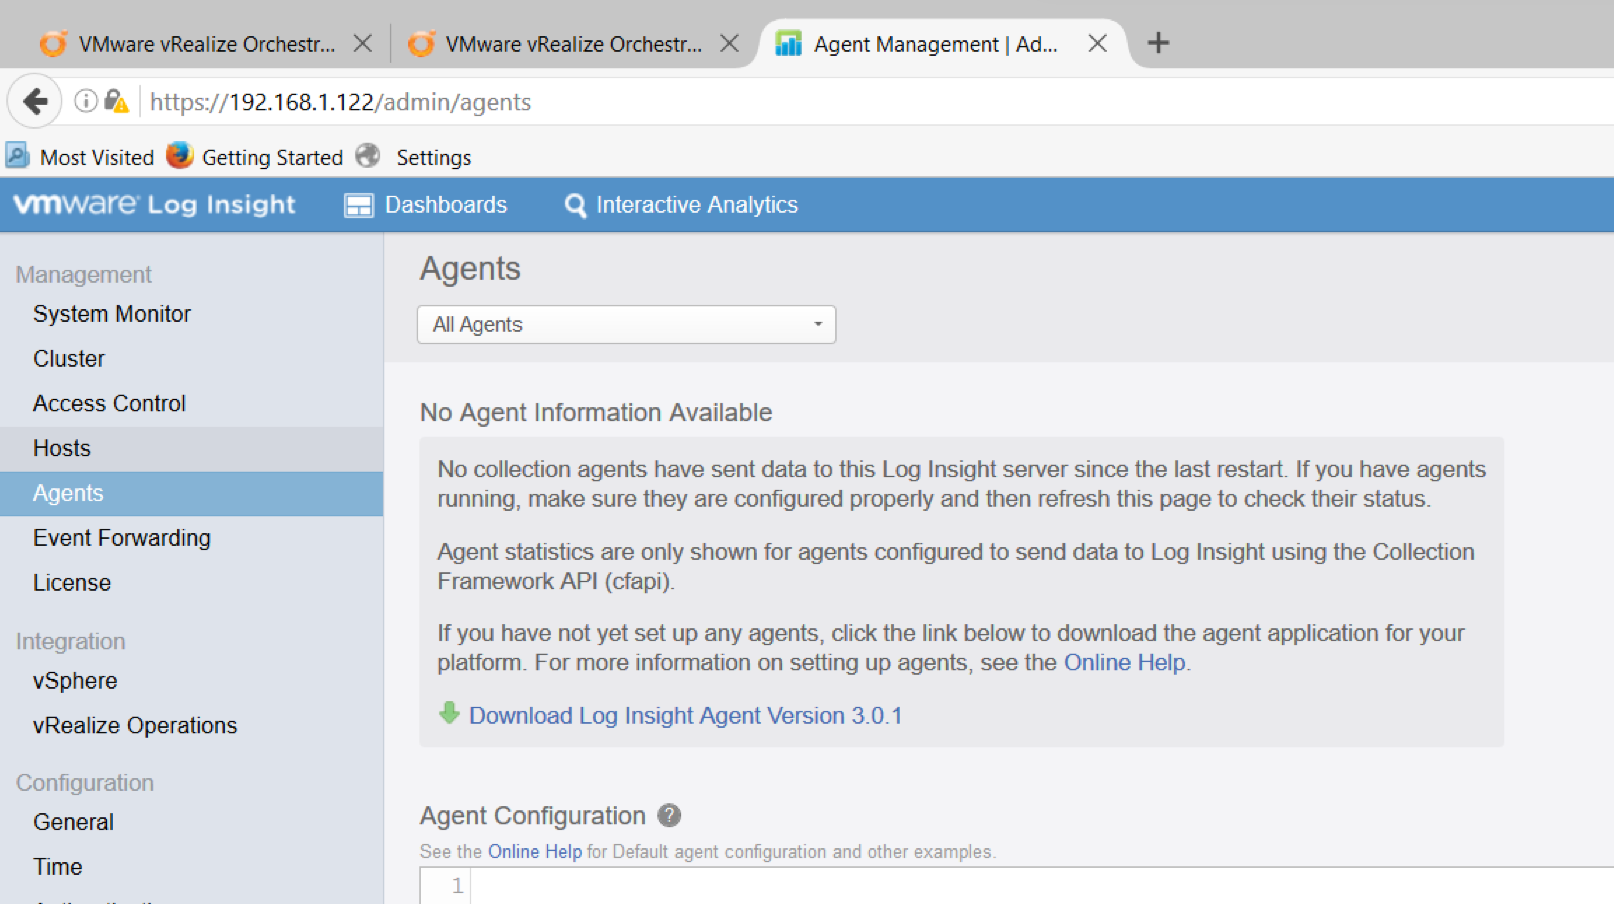
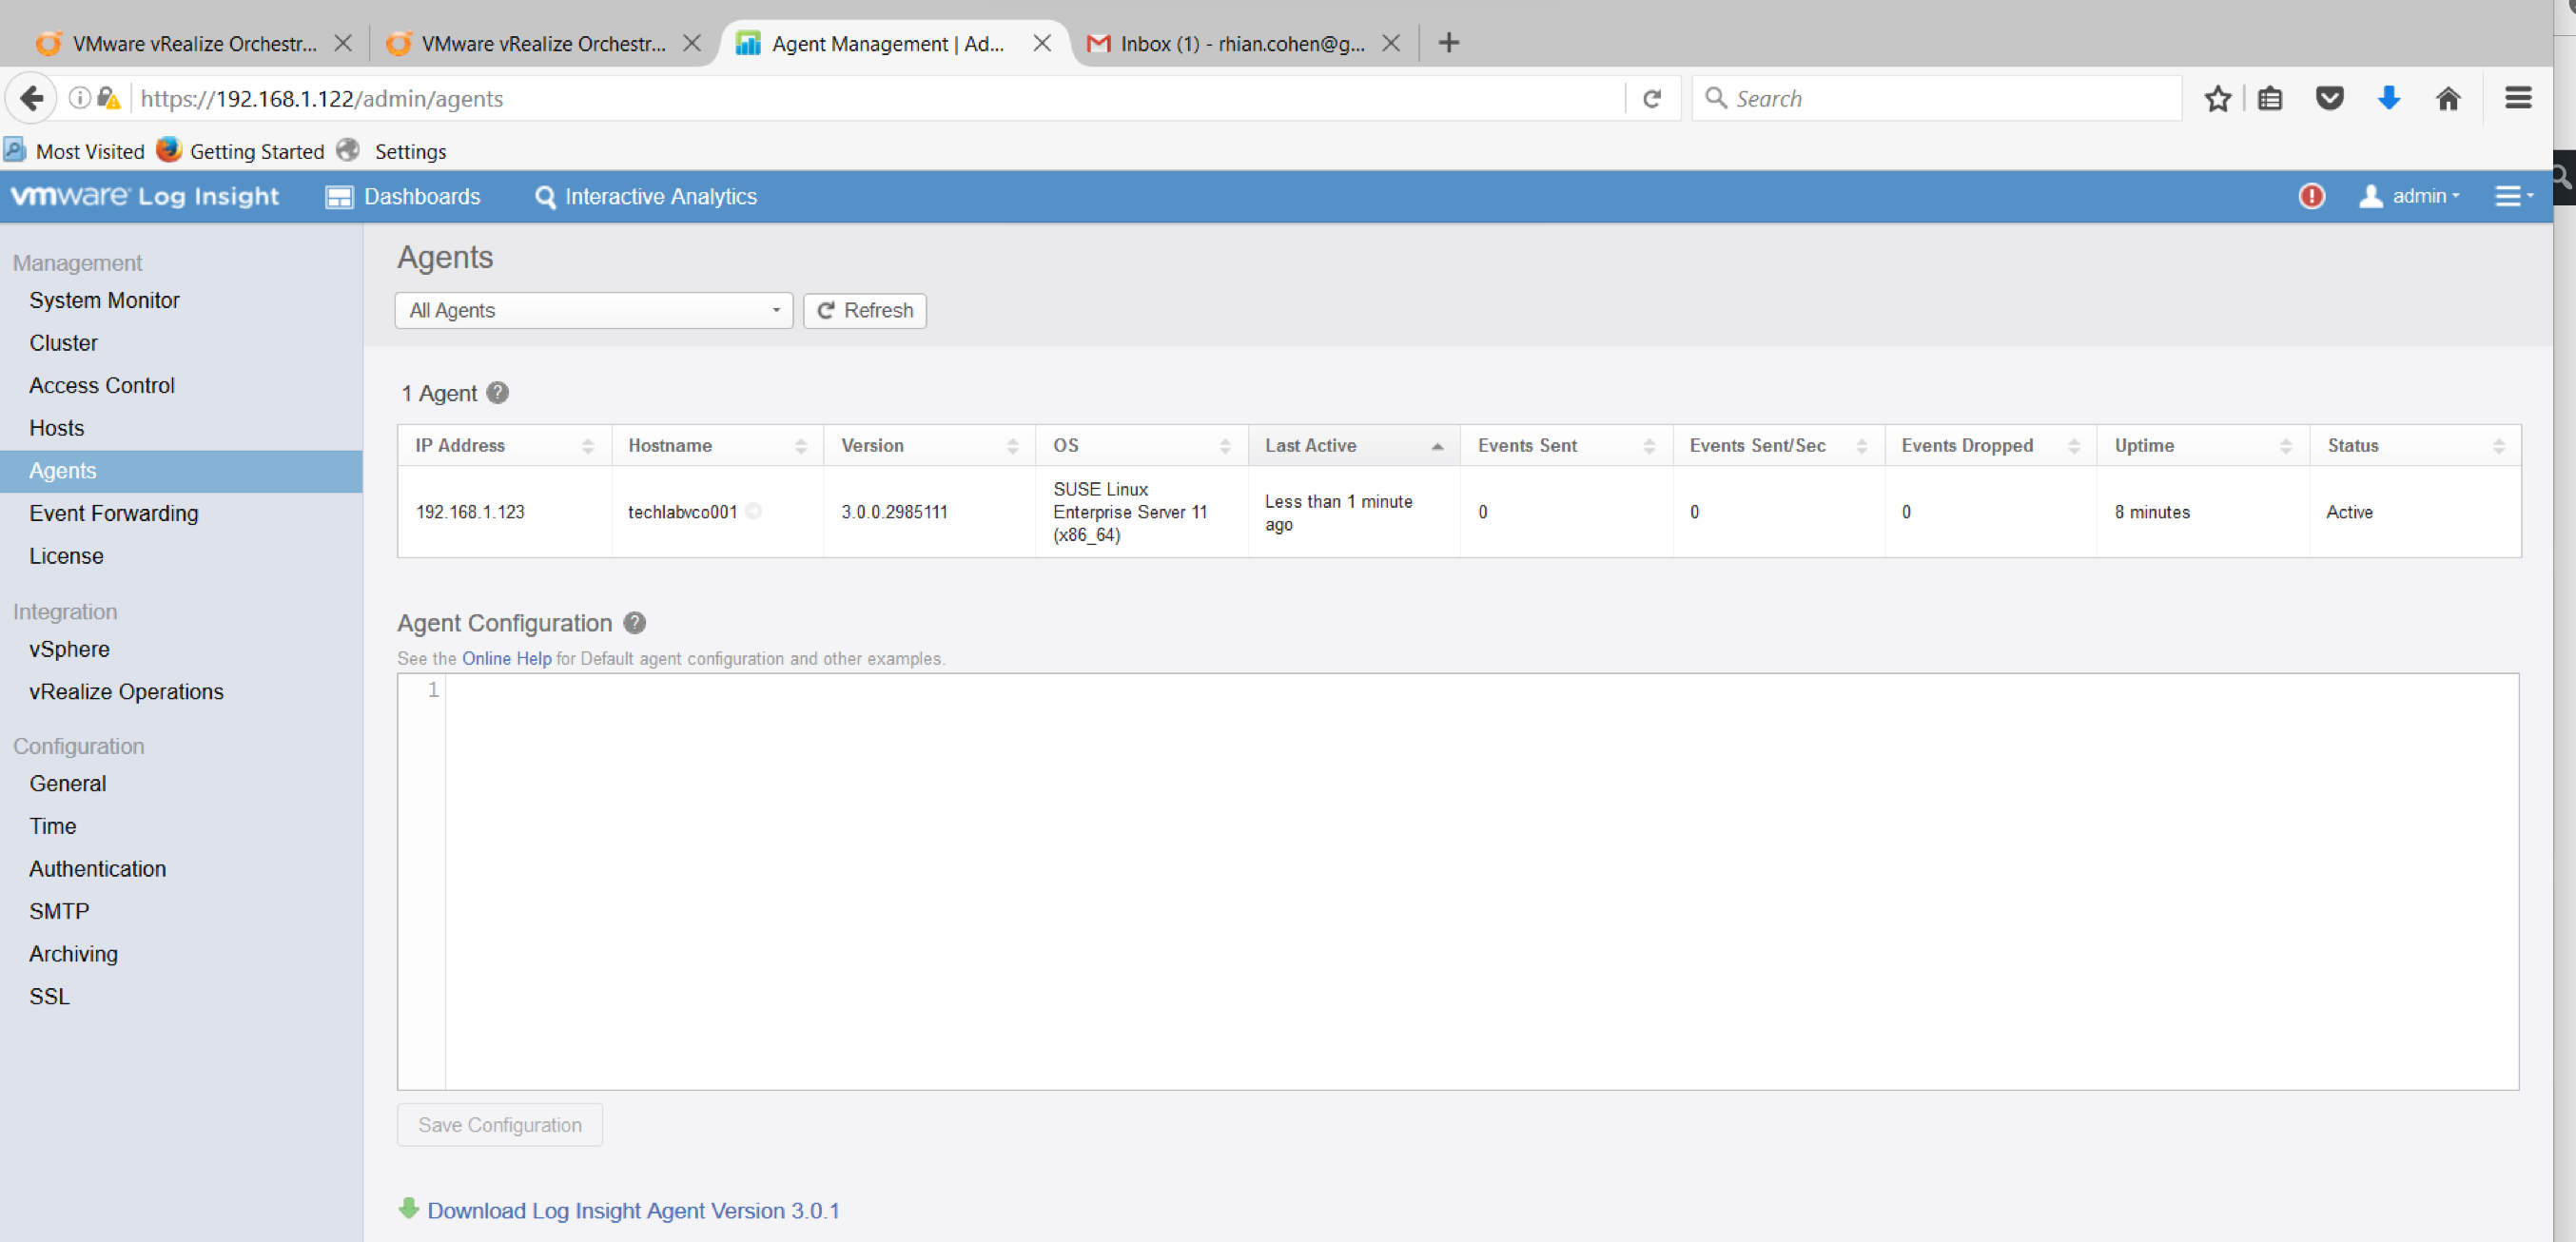
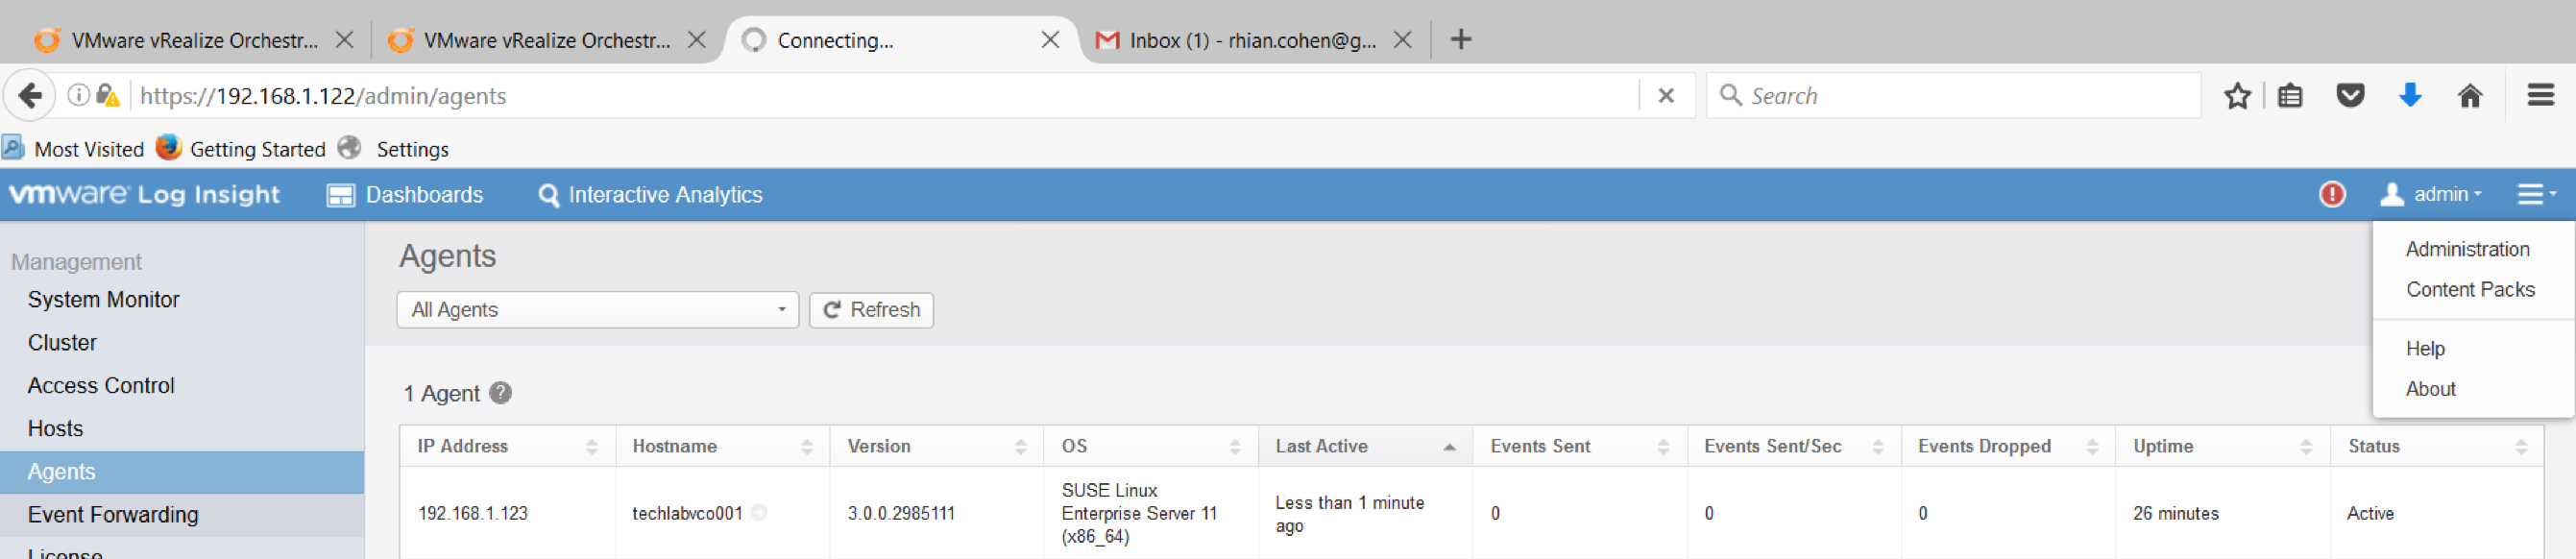
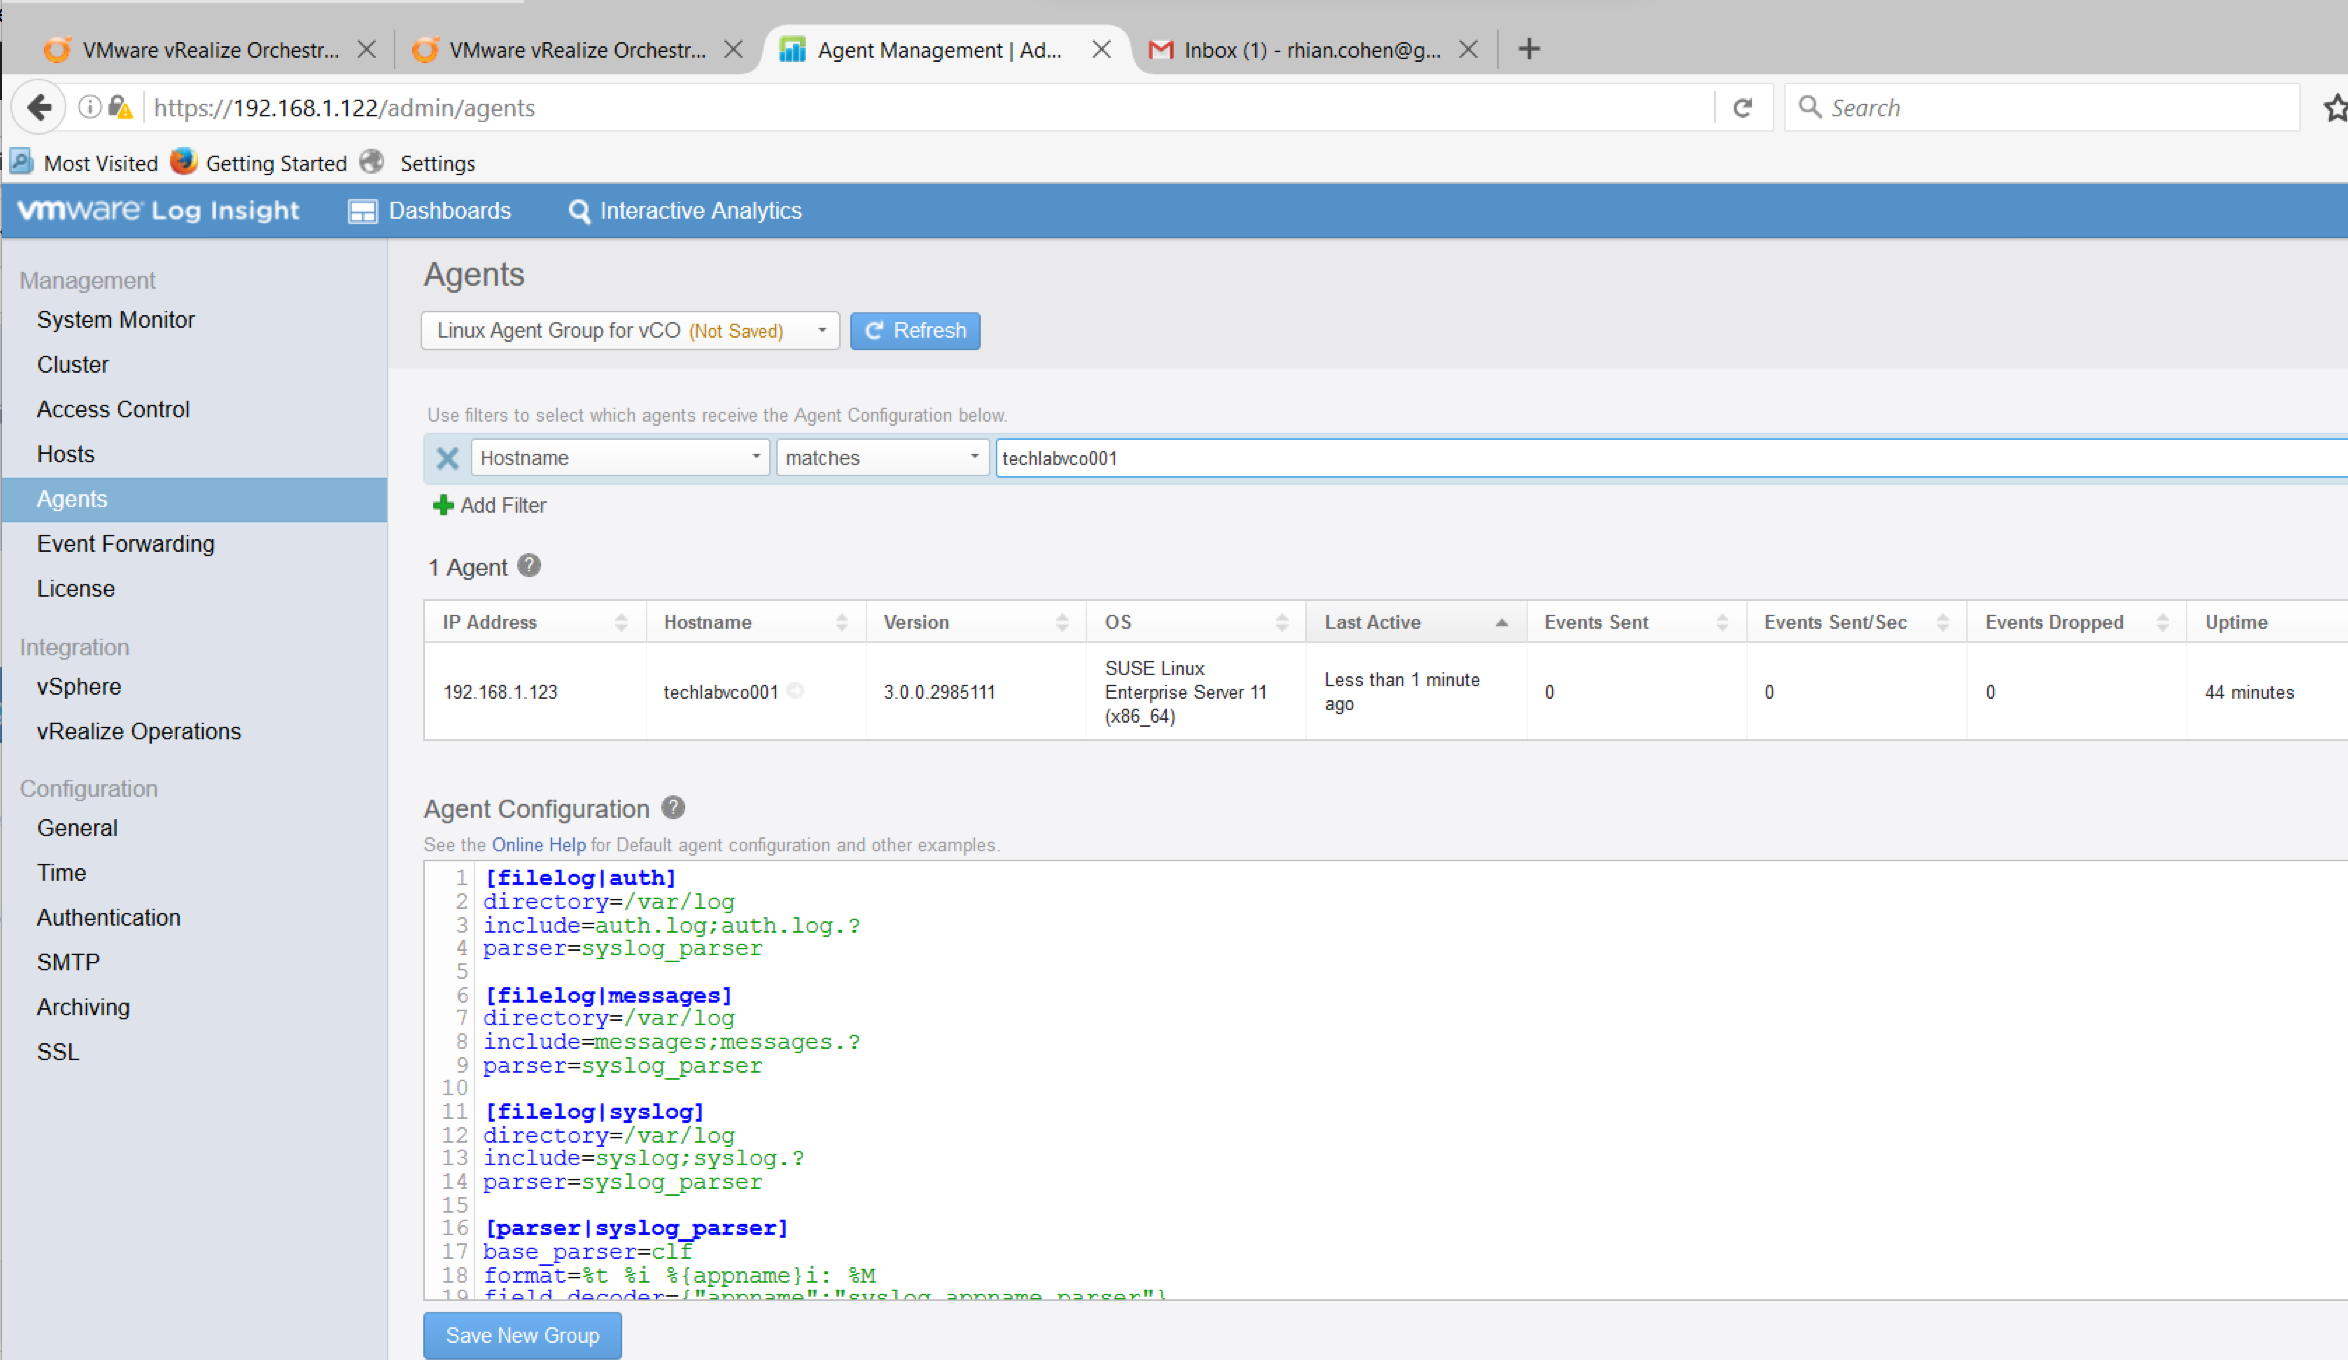
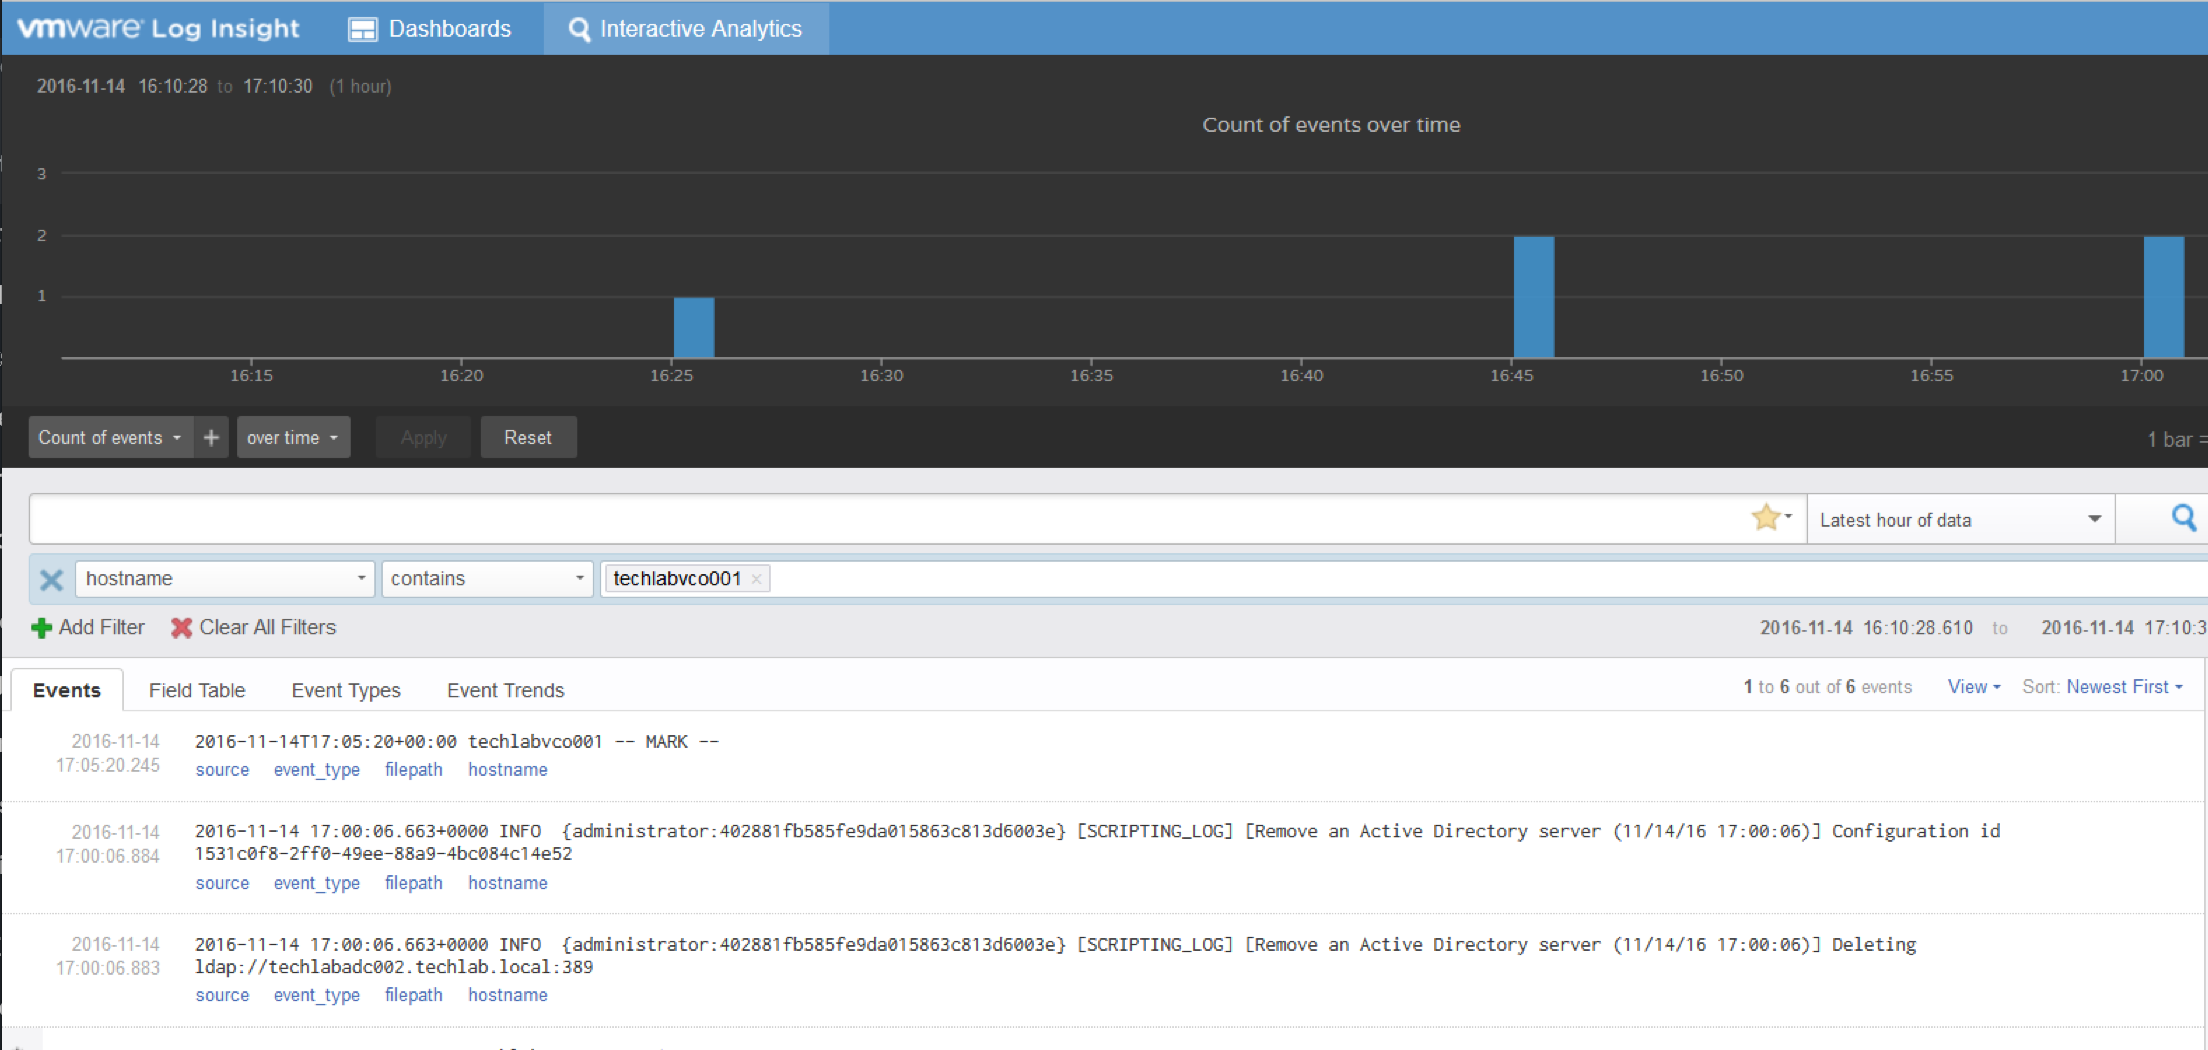
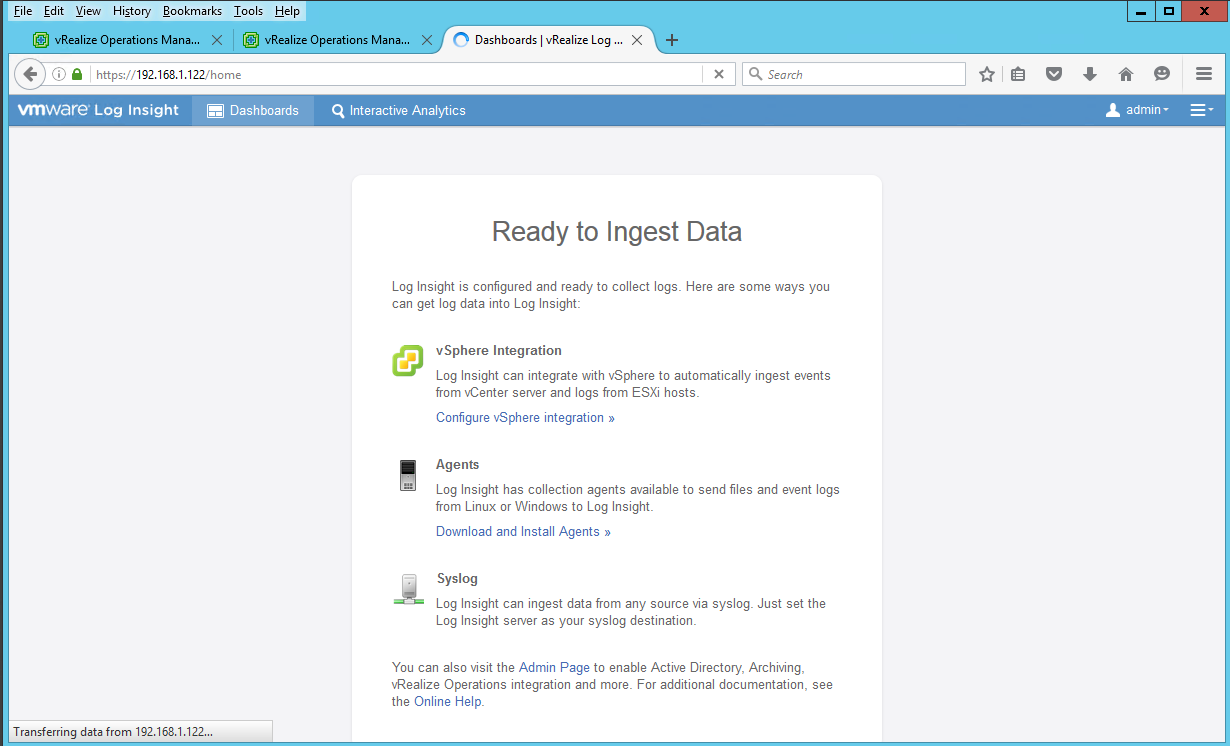
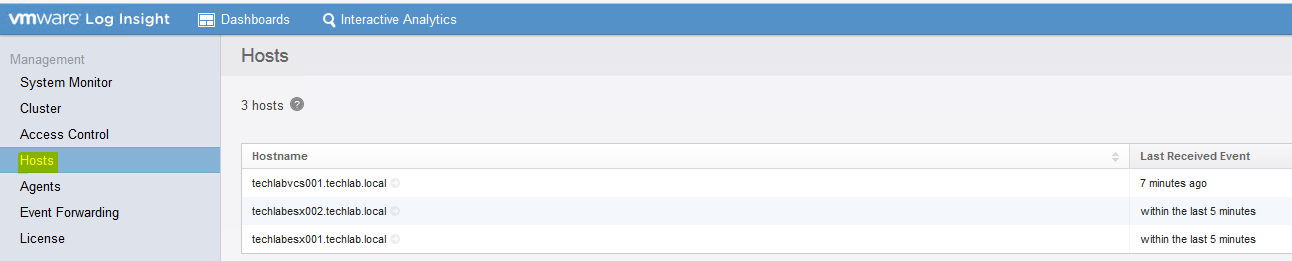
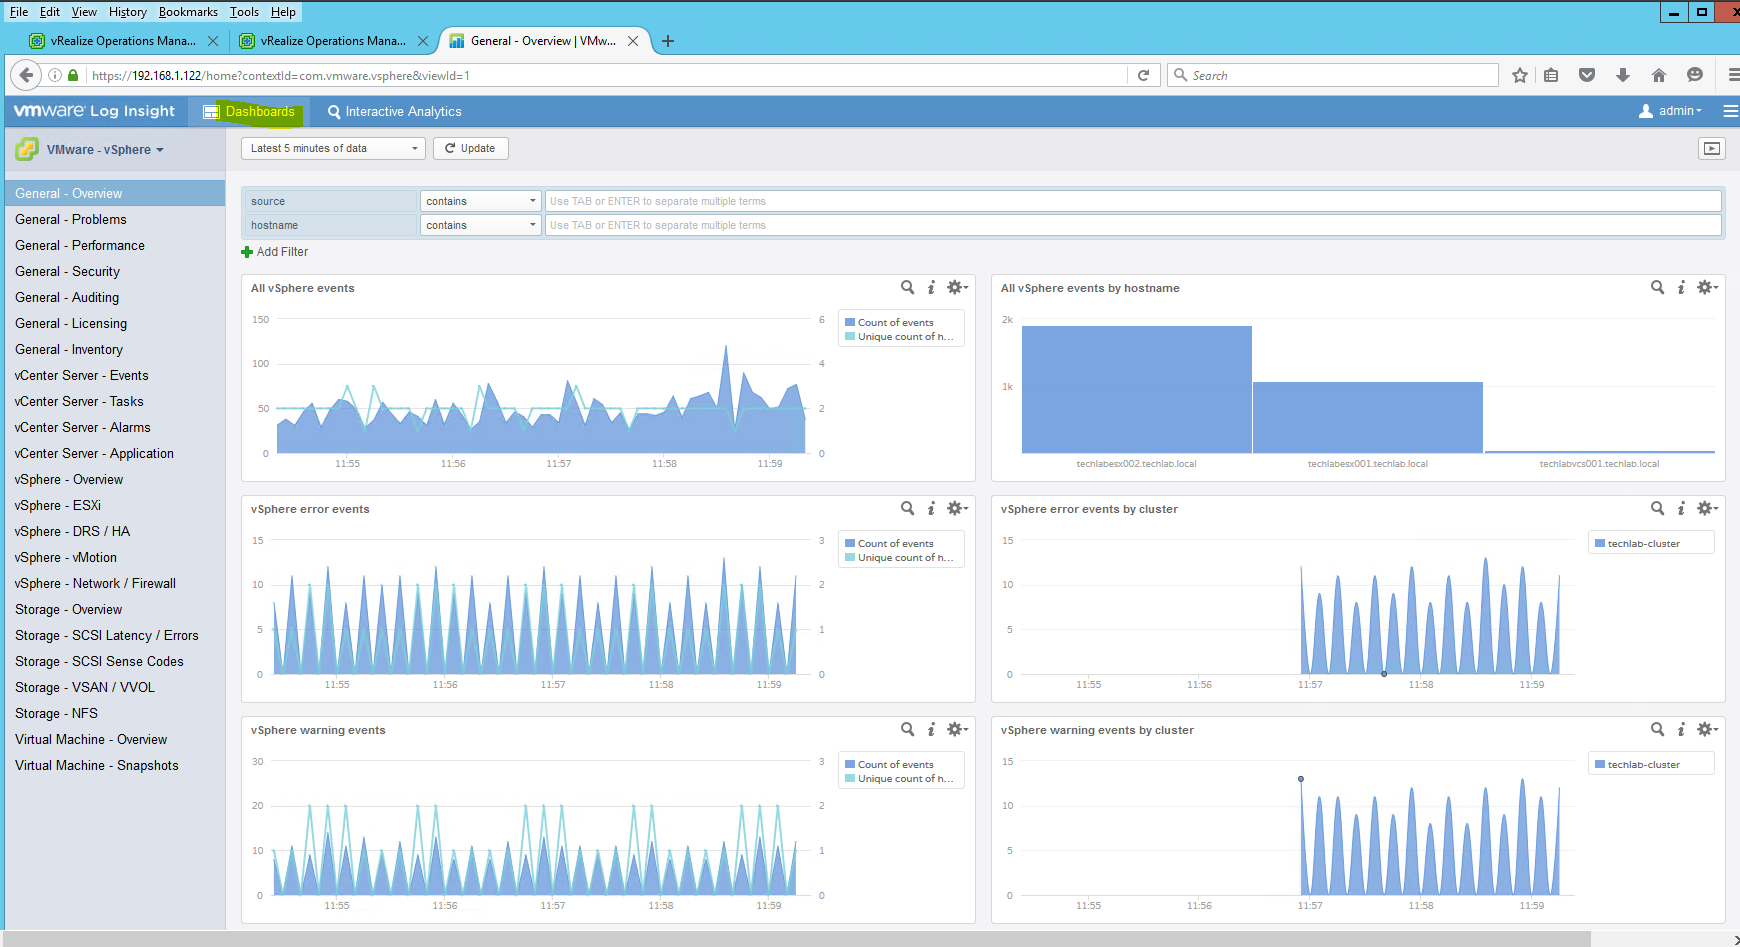
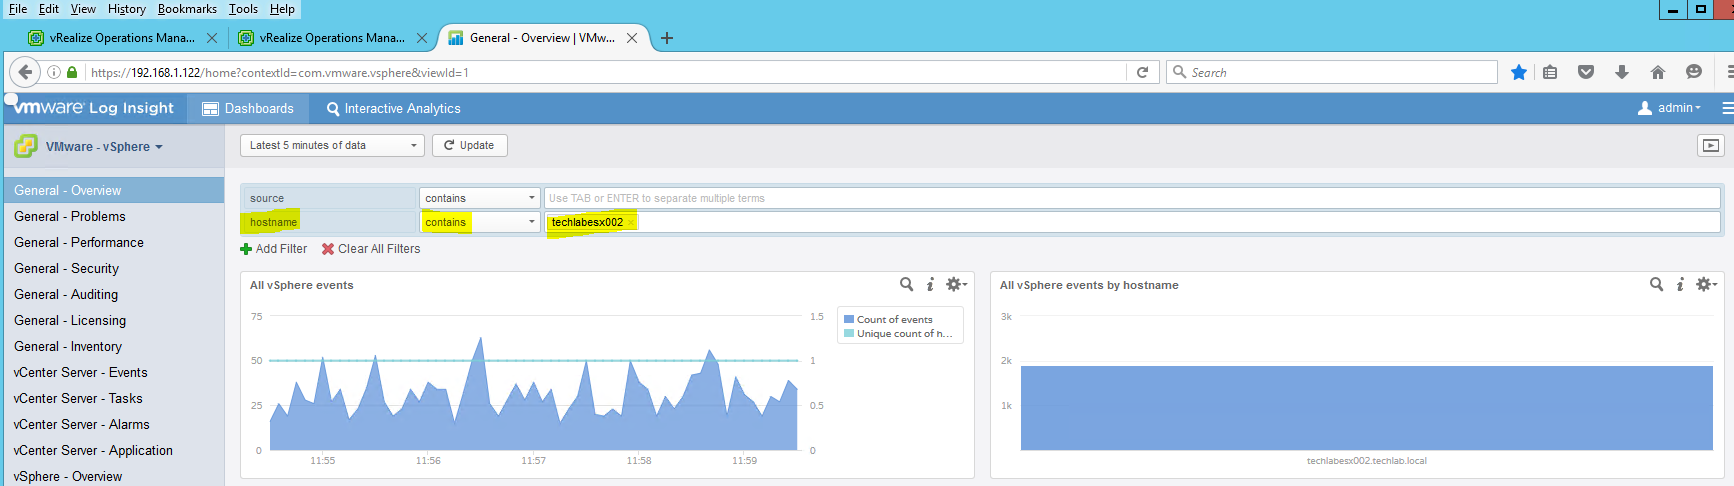
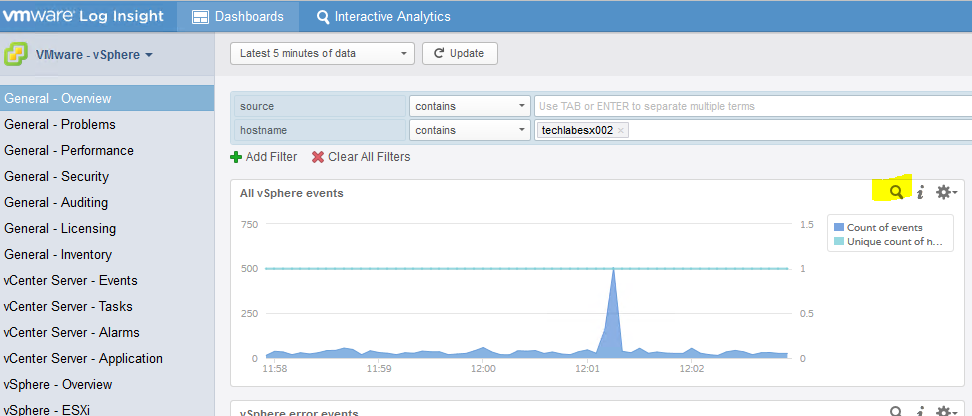
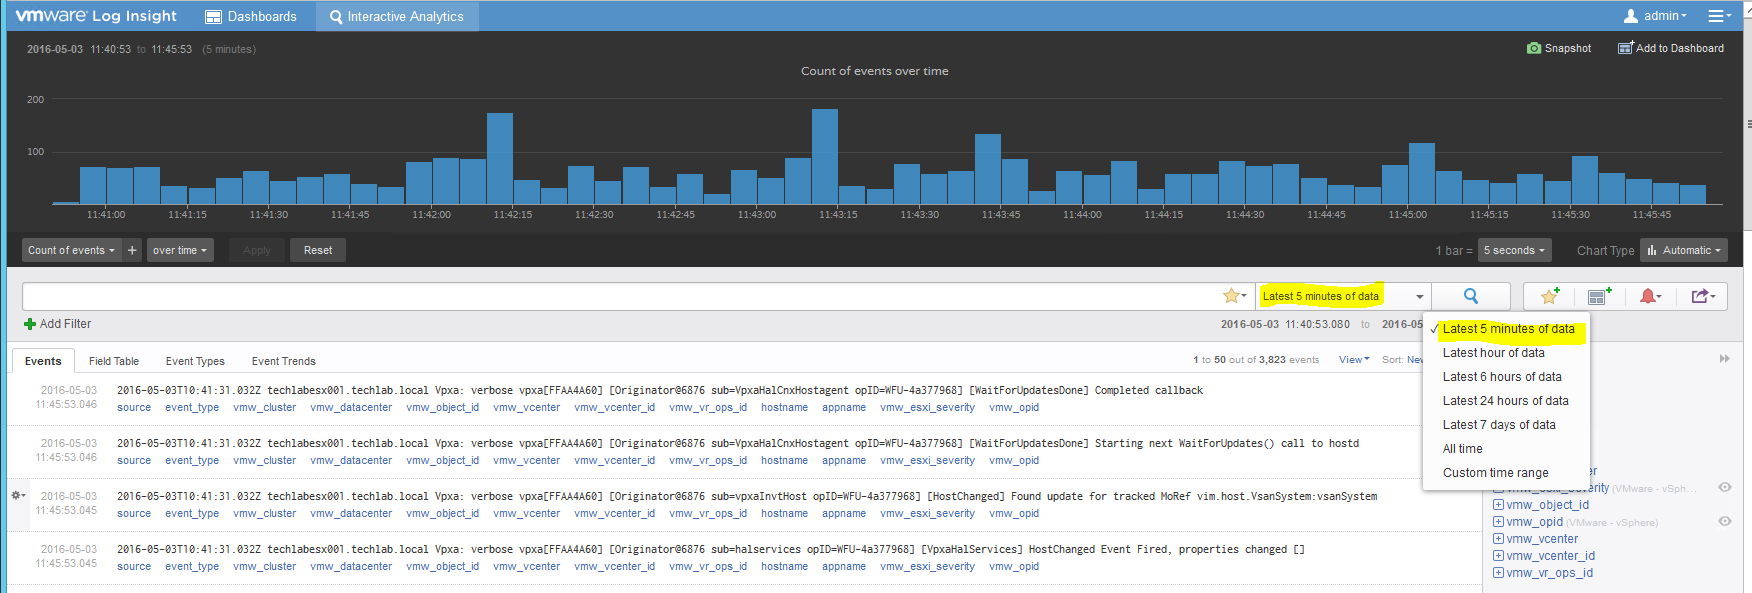
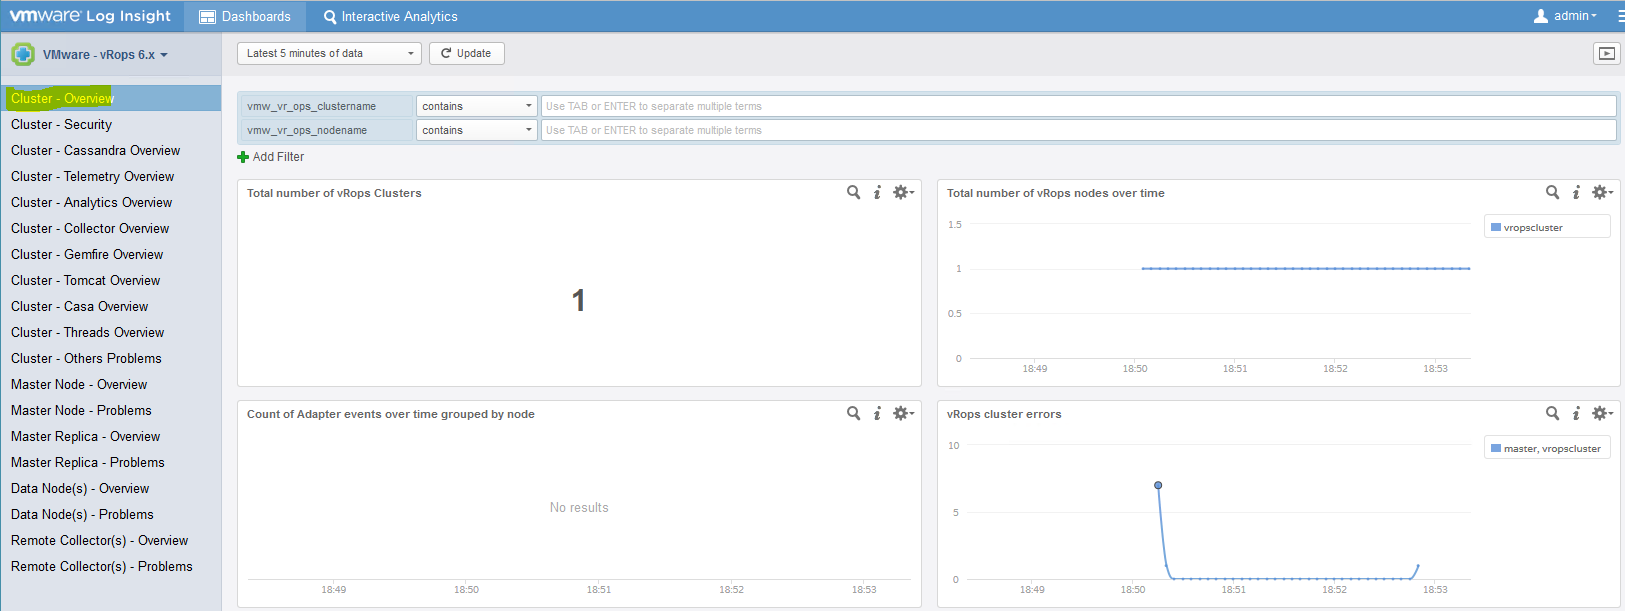
- Following this we can go to our LogInsight server and check whether we have data coming in
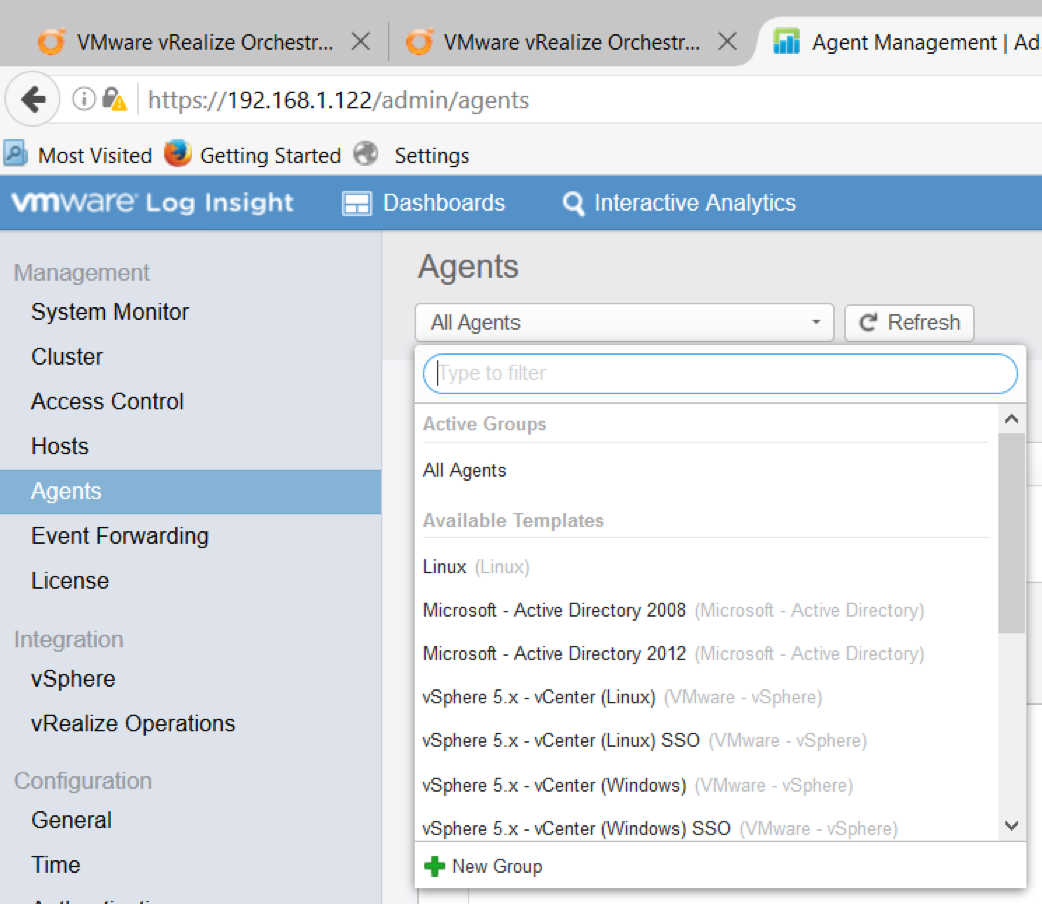
- Go to Dashboards and click on the dropdown on the left hand side
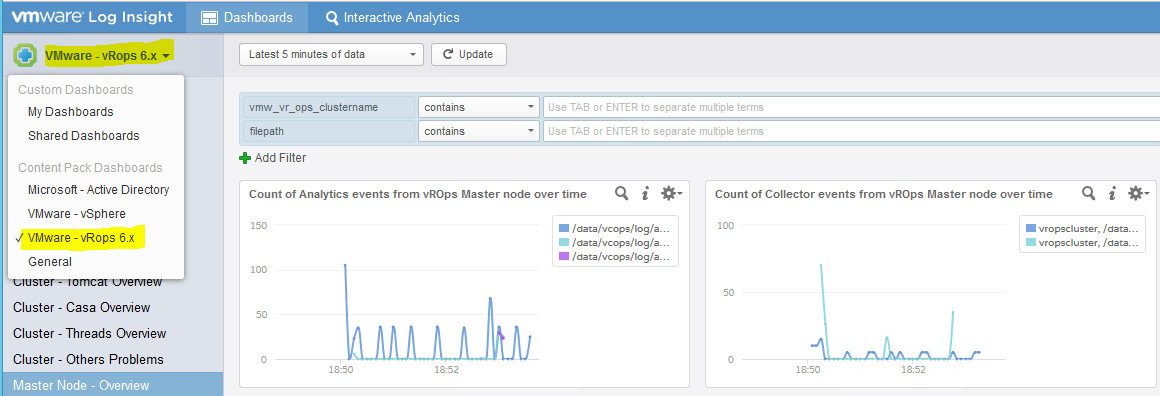
- You should now see data starting to come in
- Note: If you had previously configured vRealize Operations 6.0.x to send its logs to Log Insight directly by editing the logger configuration, you should now undo this configuration. Leaving it in place will result in some logs being sent to Log Insight twice, and may even confuse the content pack