![]()
What is VMware VisualEsxtop?
VisualEsxtop is an enhanced version of resxtop and esxtop which are the original default performance tools accessed via Putty/SSH into your VMware Hosts. VisualEsxtop is a GUI based tool which can connect to VMware vCenter Server or ESX hosts, and display ESX server stats with a better user interface and more advanced features.You must have ESX 3.5 or above. Works with vCenter Server 4.0, 4.1, 5.0, 5.1 and 5.5 Make sure Java 1.6 is in the PATH.
Features
- Live connection to ESX host or vCenter Server
- Flexible way of batch output
- Load batch output and replay them
- Multiple windows to display different data at the same time
- Line chart for selected performance counters
- Flexible counter selection and filtering
- Embedded tooltip for counter description
- Color coding for important counters
Link
https://labs.vmware.com/flings/visualesxtop
Instructions
- Go the the web link above and download VisualEsxtop
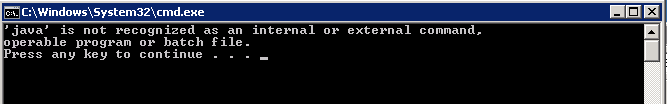
- Run visualEsxtop.sh (linux) or visualEsxtop.bat (Windows)
- If you get the below message then you will need to download Java and install it
- https://www.java.com/en/download/manual.jsp
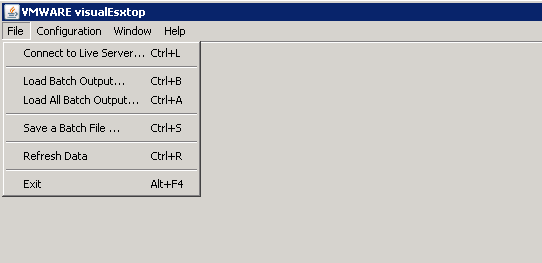
- The following screen will appear
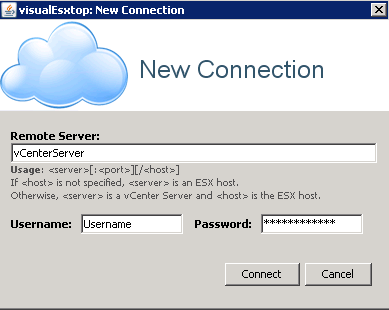
- Select Connect to Live Server
- Put in your host or your vCenter Server
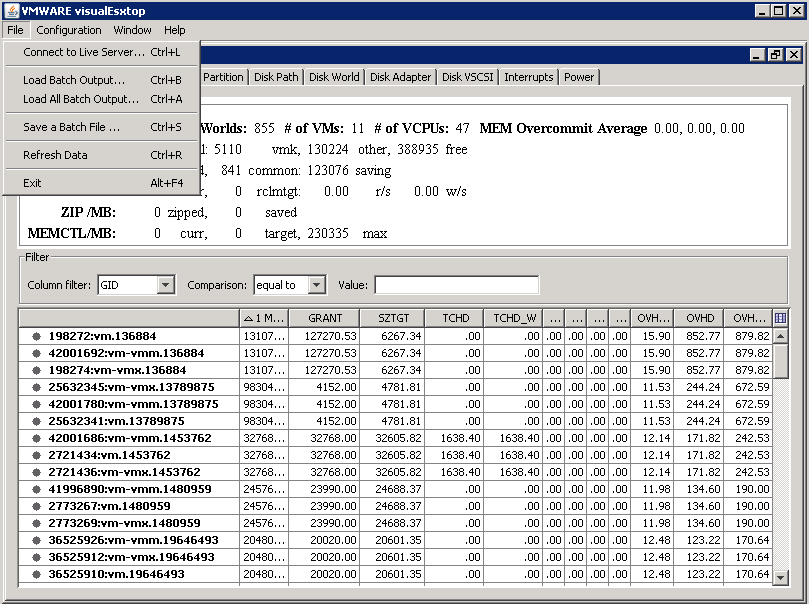
- Once the connection is established, you will be redirected to the VisualEsxtop home screen. Double click the Object Types to open up the whole menu
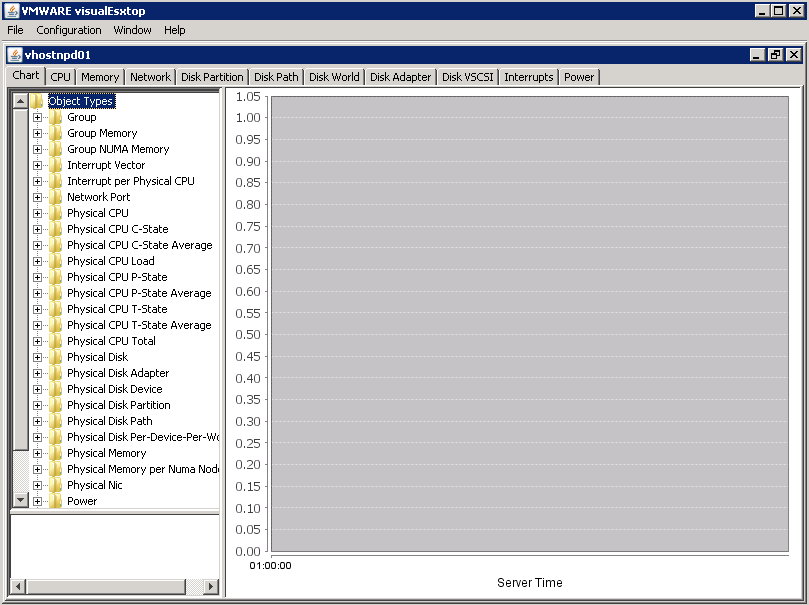
- Click through each of the tabs to see what you have
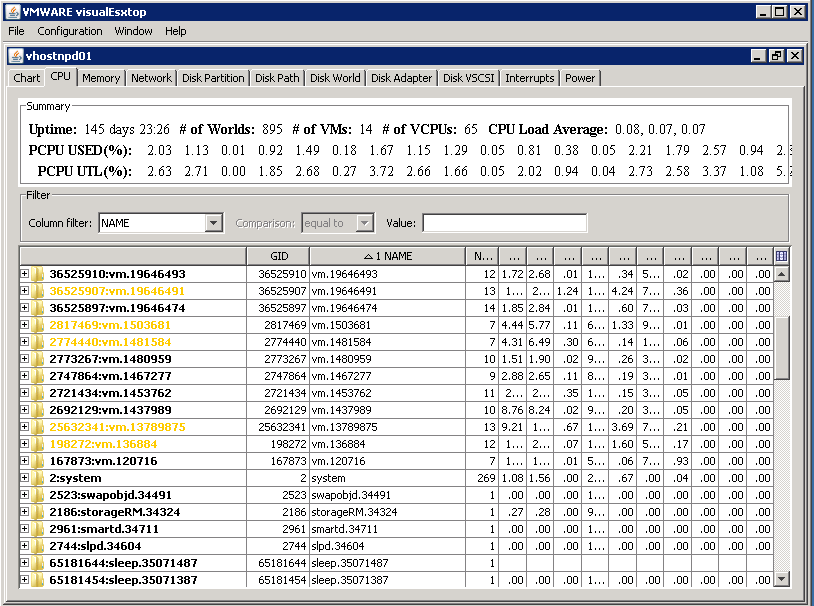
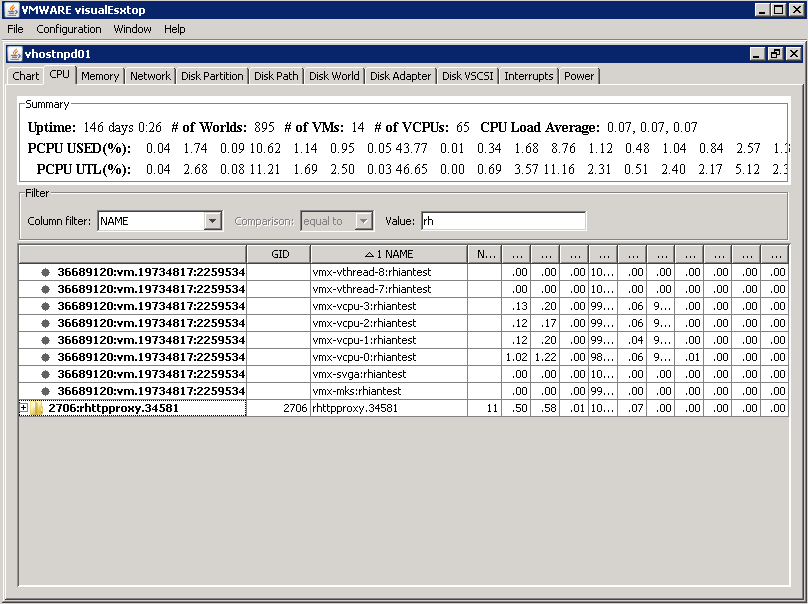
- CPU
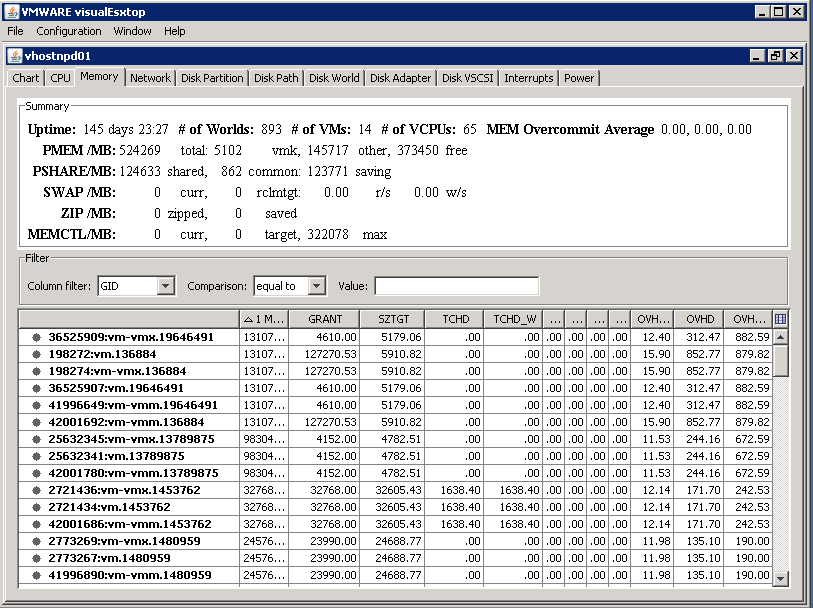
- Memory
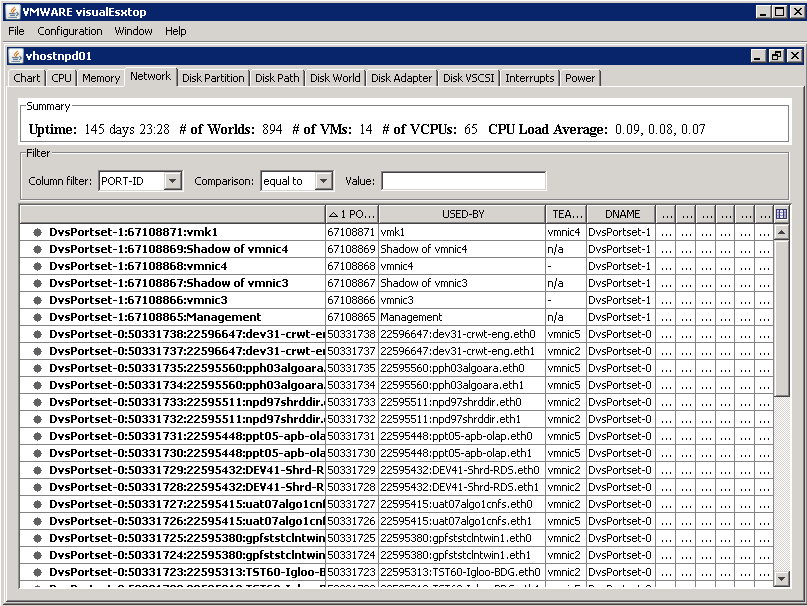
- Network
- You can go through the rest of the tabs to see what you have
- If you look at the Filter section, you can narrow it down to the VM you want to look at as well. See below
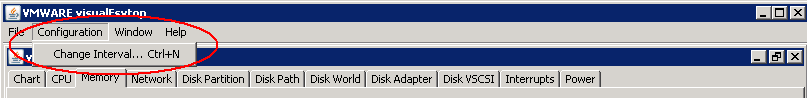
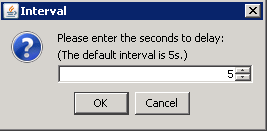
- You can change the interval as well
- Type in the interval you want
- Other options including Saving and Loading Batch Output