Archive for Monitoring

Understanding CPU Ready Time in VMware 5.x

clock

General Rules for Processor Scheduling

  1. ESX(i) schedules VMs onto and off of processors as needed
  2. Whenever a VM is scheduled to a processor, all of the cores must be available for the VM to be scheduled or the VM cannot be scheduled at all
  3. If a VM cannot be scheduled to a processor when it needs access, VM performance can suffer a great deal.
  4. When VMs are ready for a processor but are unable to be scheduled, this creates what VMware calls the CPU % Ready values
  5. CPU % Ready manifests itself as a utilisation issue but is actually a scheduling issue
  6. VMware attempts to schedule VMs on the same core over and over again and sometimes it has to move to another processor. Processor caches contain certain information that allows the OS to perform better. If the VM is actually moved across sockets and the cache isn’t shared, then it needs to be loaded with this new info.
  7. Maintain consistent Guest OS configurations

Monitoring CPU Ready Time

CPU Ready Time is the time that the VM waits in a ready-to-run state (meaning it has work to do) to be scheduled on one or more of the physical CPUs by the hypervisor. It is generally normal for VMs to have small values for CPU Ready Time accumulating even if the hypervisor is not over subscribed or under heavy activity, it’s just the nature of shared scheduling in virtualization. For SMP VMs with multiple vCPUs the amount of ready time will generally be higher than for VMs with fewer vCPUs since it requires more resources to schedule/co-schedule the VM when necessary and each of the vCPUs accumulates the time separately.

There are 2 ways to monitor CPU Ready times.

  • esxtop/resxtop
  • Performance Overview Charts in vCenter

ESXTOP/RESXTOP

  • Open Putty and log into your host. Note: You may need to enable SSH in vCenter for the hosts first
  • Type esxtop
  • Press c for CPU
  • Press V for Virtual Machine view

esxtopcpu

  • %USED – (CPU Used time) % of CPU used at current time.  This number is represented by 100 X Number_of_vCPU’s so if you have 4 vCPU’s and your %USED shows 100 then you are using 100% of one CPU or 25% of four CPU’s.
  • %RDY – (Ready) % of time a vCPU was ready to be scheduled on a physical processor but could not be due to contention.  You do not want this above 10% and should look into anything above 5%.
  • %CSTP – (Co-Stop) % in time a vCPU is stopped waiting for access to physical CPU high numbers here represent problems.  You do not want this above 5%
  • %MLMTD – (Max Limited) % of time vmware was ready to run but was not scheduled due to CPU Limit set (you have a limit setting)
  • %SWPWT – (Swap Wait) – Current page is swapped out

Performance Monitor in vCenter

If you are looking at the Ready/Summation data in the perf chart below for the CPU Ready time, converting it to a CPU Ready percent value is what provides the proper meaning to the data for understanding whether or not it is actually a problem. However, keep in mind that other configuration options like CPU Limits can affect the accumulated CPU Ready time and other VMs vCPU configuration on the same host should be checked as well as it is not good to have VMs with large amounts of vCPUs running on a host with VMs with single vCPUs

cpuready

To convert between the CPU ready summation value in vCenter’s performance charts and the CPU ready % value that you see in esxtop, you must use a formula. At one point VMware had a recommendation that anything over 5% ready time per vCPU was something to monitor
The formula requires you to know the default update intervals for the performance charts.

These are the default update intervals for each chart:

Realtime:20 seconds
Past Day: 5 minutes (300 seconds)
Past Week: 30 minutes (1800 seconds)
Past Month: 2 hours (7200 seconds)
Past Year: 1 day (86400 seconds)

To calculate the CPU ready % from the CPU ready summation value, use this formula:
(CPU summation value / (<chart default update interval in seconds> * 1000)) * 100 = CPU ready %

Example from the above chart for one day: The Realtime stats for the VM gte19-accal-rds with an average CPU ready summation value of 359.105.

(359.105 / (20s * 1000)) * 100 = 1.79% CPU ready

Useful Link

http://kb.vmware.com/selfservice/microsites/search.do?language=en_US&cmd=displayKC&externalId=2002181

Other options to check if you think you have a CPU issue

  • Verify that VMware Tools is installed on every virtual machine on the host.
  • Compare the CPU usage value of a virtual machine with the CPU usage of other virtual machines on the host or in the resource pool. The stacked bar chart on the host’s Virtual Machine view shows the CPU usage for all virtual machines on the host.
  • Determine whether the high ready time for the virtual machine resulted from its CPU usage time reaching the CPU limit setting. If so, increase the CPU limit on the virtual machine.
  • Increase the CPU shares to give the virtual machine more opportunities to run. The total ready time on the host might remain at the same level if the host system is constrained by CPU. If the host ready time doesn’t decrease, set the CPU reservations for high-priority virtual machines to guarantee that they receive the required CPU cycles.
  • Increase the amount of memory allocated to the virtual machine. This action decreases disk and or network activity for applications that cache. This might lower disk I/O and reduce the need for the host to virtualize the hardware. Virtual machines with smaller resource allocations generally accumulate more CPU ready time.
  • Reduce the number of virtual CPUs on a virtual machine to only the number required to execute the workload. For example, a single-threaded application on a four-way virtual machine only benefits from a single vCPU. But the hypervisor’s maintenance of the three idle vCPUs takes CPU cycles that could be used for other work.
  • If the host is not already in a DRS cluster, add it to one. If the host is in a DRS cluster, increase the number of hosts and migrate one or more virtual machines onto the new host.
  • Upgrade the physical CPUs or cores on the host if necessary.
  • Use the newest version of hypervisor software, and enable CPU-saving features such as TCP Segmentation Offload, large memory pages, and jumbo frames.

Memory Overcommitment and Java Applications

java

How can we monitor Java Applications on Virtualised Systems?

We can’t determine all we need to know about a Java workload from system tools such as System Monitor. We need to use specialized Java monitoring tools such as the below tools which helps us see inside the Java Heap, Garbage Collection, and other relevant Java metrics.

  • JConsole
  • vCenter Operations Suite

What is the Java Heap?

The Java Heap is used to store objects that the program is working on. For example, an object could be a customer record, a file or anything else the program has to manipulate. As objects are created, used and discarded by the program, you will see the Heap memory size change. Discarded objects (referred to as dead objects) are not immediately removed from the heap when the program is done with them. Instead, a special task called Garbage Collection, runs through the heap to detect dead objects. Once it detects a dead object, it deletes the object and frees up the memory.

The Java Heap is divided in to pools of memory, referred to as generations. There are three generations called

  • Eden Space
  • Survivor Space
  • Tenured Gen

This helps the Garbage collection (GC) process become more efficient by reducing the amount of memory it has to scan each time a GC is run. GC is run on the ‘Eden Space’ more often as this is where new objects are stored. GC runs less often on the Survivor space and even less often on the Tenured Gen space. If an object survives one GC run in the Eden Space, it is moved to the Survivor Space. If an object exists in the Survivor Space for some time, it is moved to the Tenured Gen.

Memory Reclamation Techniques

When running Java workloads on in an x86 Virtual Machine (i.e. a VM in the VMware sense of the word), it is recommended that you do not overcommit memory because the JVM memory is an active space where objects are constantly being created and garbage collected. Such an active memory space requires its memory to be available all the time. If you overcommit memory, memory reclamation techniques such as compression, ballooning or swapping may occur and impede performance

  • Memory compression involves compressing pages of memory (zipping) and storing them compressed instead of in native format. It has a performance impact because resources are used to compress and uncompress memory as it is being accessed. The host attempts to only compress inactive memory pages if at all possible. As GC runs through the java heap, it accesses lots of memory that may behave been marked as inactive. This causes any memory that has been compressed to decompress using up further VM resources.
  • Ballooning employs the memory balloon driver (vmmemctl), which is part of the VMware Tools package. This is loaded into the guest operating system on boot. When memory resources on the host become scarce (contended), the host tells the balloon driver to request memory (inflate) up to a target size (balloon target). The target is based on the amount of inactive memory the host believes the guest is holding on to. The memory balloon driver starts to request memory from the guest OS to force the guest to clean up inactive memory. Once the balloon driver has been allocated memory by the guest OS, it releases this back to other VMs by telling the Hypervisor that the memory is available. Once again, what appears to be inactive memory to the host may soon be subject to garbage collection, and become active again. If the guest has no inactive memory to release, it starts paging memory to disk in response to the request for memory from the balloon driver. This has a very negative impact on java performance
  • Swapping. This is a last resort memory reclamation technique that no application wants to be faced with. A serious decline in performance is likely with swapping

Best Practices

  • Enterprise Java Applications on VMware Best Practice Guide, which says you should not exceed 80% CPU utilization on the ESX host.
  • Reserving memory at the VM level is in general not a good idea, but essential for Java workloads due to the highly active java memory heap space. However, creating a memory reservation is a manual intervention step that we should try to avoid. Consider the situation in a large, dynamic, automated self-service environment (i.e. Cloud). Also, if we’re reserving memory for peak workloads within our java applications, we’re wasting resources as our applications don’t run at peak workload all the time. It would be good if the Java VM would just talk to the vSphere VM to let it know what memory is active, and what memory is idle so that vSphere could manage memory better, and the administrator could consolidate Java workloads without the fear of memory contention, or reserving memory for peak times.
  • Introducing VMware vFabric Elastic Memory for Java (EM4J). With EM4J, the traditional memory balloon driver is replaced with the EM4J balloon driver. The EM4J memory balloon sits directly in the Java heap and works with new memory reclamation capabilities introduced in ESXi 5.0. EM4J works with the hypervisor to communicate system-wide memory pressure directly into the Java heap, forcing Java to clean up proactively and return memory at the most appropriate times—when it is least active. You no longer have to be so conservative with your heap sizing because unused heap memory is no longer wasted on uncollected garbage objects. And you no longer have to give Java 100% of the memory that it needs; EM4J ensures that memory is used more efficiently, without risking sudden and unpredictable performance problems.

vFabric Elastic Memory for Java (EM4J)

vFabric Elastic Memory for Java (EM4J) is a set of technologies that helps optimize memory utilization for ESXi virtual machines running Java workloads.

EM4J provides vSphere administrators with the following tools:

  • The EM4J plug-in for the vSphere Web Client, together with the EM4J Console Guest Collector, provides a detailed, historical view of virtual machine and JVM memory usage, which helps vSphere administrators size the VM and Java heap memory optimally.
  • The EM4J agent establishes a memory balloon in the Java heap, which helps maintain predictable Java application performance when host memory becomes scarce. The balloon works with the ESXi hypervisor to reclaim memory from the Java heap when other VMs need memory.
  • The EM4J plug-in and the EM4J agent can be used together or independently.

For more information about EM4J, see vFabric Elastic Memory for Java Documentation at the link below

http://www.vmware.com/support/pubs/vfabric-em4j.html


Unable to clear the Hardware Status warnings/errors in vCenter Server

Unable to clear the Hardware Status warnings/errors in vCenter Server

Purpose

This article provides steps to clear the warnings/errors in the Hardware Status tab of a host within vCenter Server.

The Hardware Status tab shows warnings/errors related to hardware components. In some cases, these warnings and errors are not cleared even after you ensure that the hardware faults are resolved and trigger vCenter Server alarms. In these cases, you may have to clear these warnings/errors manually.

sensor1

Resolution

To clear the warnings/errors from the Hardware Status tab:
  • Go to Hardware Status tab and select the System event log view.
  • Click Reset event log
  • Click Update. The error should now be cleared.
  • Select the Alerts and warnings view.
  • Click Reset sensors.
  • Click Update. The memory should now be cleared.
  • If the error is not cleared, connect to the host via SSH.
  • Restart the sfcbd service
  • To restart the service in ESXi, run this command:
  • services.sh restart
  • To restart the service in ESX, run this command
  • service sfcbd restart
  • Click Update. The error should now be cleared.
  • Note: If the warning/error is cleared after a reset in Step 2 and Step 5, you need not restart the management agents

vmkusage (VMware Monitoring Tool)

What is vmkusage?

vmkusage used to be a very nice tool VMware provided (non supported application) that existed for ESX 1.5x and 2.x. In the beginning you had to download it separately from VMware, but since ESX 2.1.0 it was included in the standard ESX install (but not activated).

When ESX 3 was released, a lot of things had changed. VMware also wanted a single point of operation and the performance stats in the Virtual Infrastructure Client had been much improved and was meant as a replacement of vmkusage. The result was that vmkusage was discontinued.

In Virtual Center 2.5u4 a similar service as vmktree was reintroduced as an optional plugin, and this is installed by default in vCenter 4.0. It is not vmkusage (which was perl based), but a java based solution that runs on port 8443 and is accessed directly from vCenter 4.0.

Link for Install Instructions

http://kb.vmware.com/selfservice/microsites/search.do?language=en_US&cmd=displayKC&externalId=1008296

vmktree 0.4.1 with support for ESX(i) 4.1

Key features:

– Support for 4.1 ESX and ESXi only
– Providing stats for core four of the host (+more). Currently lacking networking stats per VM.
– Supporting many new values provided by ESX 4.1 such as: memory compression, power usage, disk latency, queues, etc….
– Since many new values have been added, the database is not backward compatible with older versions (only parts)

Installation:

1. Deploy VMware vMA from URL:  http://download3.vmware.com/software/vma/vMA-4.1.0.0-268837.ovf
2. Start the vMA VM, configure ip, pw, etc. Login as vm-admin
3. Download vmktree: wget vmktree.org/vmktree-0.4.1.tar.bz2
4. tar xjvf vmktree-0.4.1.tar.bz2
5. cd vmktree-0.4.1
6. sudo ./install.pl
7. vmktree-addesx
8. Open your web browser and point to http://ip-or-name-of-vma/vmktree

SSH needs to be enabled so make sure your ESXi hosts have “Remote Tech support (SSH)” enabled.

ESXi hosts lose their ssh keys after reboot so check out this workaround.

Download Link

http://vmktree.org/

VMware vSphere Performance Resolution Cheat Sheet

Memory Over Allocation for VM’s – What Happens?

ESX employs a share-based allocation algorithm to achieve efficient memory utilization for all virtual machines and to guarantee memory to those virtual machines which need it most

ESX provides three configurable parameters to control the host memory allocation for a virtual machine

  • Shares
  • Reservation
  • Limit

Limit is the upper bound of the amount of host physical memory allocated for a virtual machine. By default, limit is set to unlimited, which means a virtual machine’s maximum allocated host physical memory is its specified virtual machine memory size

Reservation is a guaranteed lower bound on the amount of host physical memory the host reserves for a virtual machine even when host memory is overcommitted.

Memory Shares entitle a virtual machine to a fraction of available host physical memory, based on a proportional-share allocation policy. For example, a virtual machine with twice as many shares as another is generally entitled to consume twice as much memory, subject to its limit and reservation constraints.

Periodically, ESX computes a memory allocation target for each virtual machine based on its share-based entitlement, its estimated working set size, and its limit and reservation. Here, a virtual machine’s working set size is defined as the amount of guest physical memory that is actively being used. When host memory is undercommitted, a virtual machine’s memory allocation target is the virtual machine’s consumed host physical memory size with headroom

VMware Resource Management (Memory)

VMware® ESX(i)™ is a hypervisor designed to efficiently manage hardware resources including CPU, memory, storage, and network among multiple, concurrent virtual machines.

Memory Overcommittment

The concept of memory overcommitment is fairly simple: host memory is overcommitted when the total amount of guest physical memory of the running virtual machines is larger than the amount of actual host memory. ESX supports memory overcommitment from the very first version, due to two important benefits it provides:

  • Higher memory utilization: With memory overcommitment, ESX ensures that host memory is consumed by active guest memory as much as possible. Typically, some virtual machines may be lightly loaded compared to others. Their memory may be used infrequently, so for much of the time their memory will sit idle. Memory overcommitment allows the hypervisor to use memory reclamation techniques to take the inactive or unused host physical memory away from the idle virtual machines and give it to other virtual machines that will actively use it.
  • Higher consolidation ratio: With memory overcommitment, each virtual machine has a smaller footprint in host memory usage, making it possible to fit more virtual machines on the host while still achieving good performance for all virtual machines. For example, as shown in Figure 3, you can enable a host with 4G host physical memory to run three virtual machines with 2G guest physical memory each. Without memory overcommitment, only one virtual machine can be run because the hypervisor cannot reserve host memory for more than one virtual machine, considering that each virtual machine has overhead memory.

ESX uses several innovative techniques to reclaim virtual machine memory, which are:

  • Transparent page sharing (TPS)
  • Reclaims memory by removing redundant pages with identical content
  • Ballooning
  • Reclaims memory by artificially increasing the memory pressure inside the guest
  • Hypervisor/Host swapping
  • Reclaims memory by having ESX directly swap out the virtual machine’s memory
  • Memory compression
  • Reclaims memory by compressing the pages that need to be swapped out

Transparent Page Sharing

When multiple virtual machines are running, some of them may have identical sets of memory content. This presents opportunities for sharing memory across virtual machines (as well as sharing within a single virtual machine). For example, several virtual machines may be running the same guest operating system, have the same applications, or contain the same user data. With page sharing, the hypervisor can reclaim the redundant copies and keep only one copy, which is shared by multiple virtual machines in the host physical memory. As a result, the total virtual machine host memory consumption is reduced and a higher level of memory overcommitment is possible.
In ESX, the redundant page copies are identified by their contents. This means that pages with identical content can be shared regardless of when, where, and how those contents are generated. ESX scans the content of guest physical memory for sharing opportunities. Instead of comparing each byte of a candidate guest physical page to other pages, an action that is prohibitively expensive, ESX uses hashing to identify potentially identical pages.

A hash value is generated based on the candidate guest physical page’s content. The hash value is then used as a key to look up a global hash table, in which each entry records a hash value and the physical page number of a shared page. If the hash value of the candidate guest physical page matches an existing entry, a full comparison of the page contents is performed to exclude a false match. Once the candidate guest physical page’s content is confirmed to match the content of an existing shared host physical page, the guest physical to host physical mapping of the candidate guest physical page is changed to the shared host physical page, and the redundant host memory copy (the page pointed to by the dashed arrow in the Figure above) is reclaimed. This remapping is invisible to the virtual machine and inaccessible to the guest operating system. Because of this invisibility, sensitive information cannot be leaked from one virtual machine to another.

A standard copy-on-write (CoW) technique is used to handle writes to the shared host physical pages. Any attempt to write to the shared pages will generate a minor page fault. In the page fault handler, the hypervisor will transparently create a private copy of the page for the virtual machine and remap the affected guest physical page to this private copy. In this way, virtual machines can safely modify the shared pages without disrupting other virtual machines sharing that memory. Note that writing to a shared page does incur overhead compared to writing to non-shared pages due to the extra work performed in the page fault handler.
In VMware ESX, the hypervisor scans the guest physical pages randomly with a base scan rate specified by Mem.ShareScanTime, which specifies the desired time to scan the virtual machine’s entire guest memory. The maximum number of scanned pages per second in the host and the maximum number of per-virtual machine scanned pages, (that is, Mem.ShareScanGHz and Mem.ShareRateMax respectively) can also be specified in ESX advanced settings. An example is shown in the Figure below

The default values of these three parameters are carefully chosen to provide sufficient sharing opportunities while keeping the CPU overhead negligible. In fact, ESX intelligently adjusts the page scan rate based on the amount of current shared pages. If the virtual machine’s page sharing opportunity seems to be low, the page scan rate will be reduced accordingly and vice versa. This optimization further mitigates the overhead of page sharing.
In hardware-assisted memory virtualization (for example, Intel EPT Hardware Assist and AMD RVI Hardware Assist systems, ESX will automatically back guest physical pages with large host physical pages (2MB contiguous memory region instead of 4KB for regular pages) for better performance due to less TLB misses. In such systems, ESX will not share those large pages because: 1) the probability of finding two large pages having identical contents is low, and 2) the overhead of doing a bit-by-bit comparison for a 2MB page is much larger than for a 4KB page. However, ESX still generates hashes for the 4KB pages within each large page. Since ESX will not swap out large pages, during host swapping, the large page will be broken into small pages so that these pre-generated hashes can be used to share the small pages before they are swapped out. In short, we may not observe any page sharing for hardware-assisted memory virtualization systems until host memory is overcommitted.

Ballooning

Ballooning is a completely different memory reclamation technique compared to transparent page sharing. Before describing the technique, it is helpful to review why the hypervisor needs to reclaim memory from virtual machines. Due to the virtual machine’s isolation, the guest operating system is not aware that it is running inside a virtual machine and is not aware of the states of other virtual machines on the same host. When the hypervisor runs multiple virtual machines and the total amount of the free host memory becomes low, none of the virtual machines will free guest physical memory because the guest operating system cannot detect the host’s memory shortage. Ballooning makes the guest operating system aware of the low memory status of the host.

In ESX, a balloon driver is loaded into the guest operating system as a pseudo-device driver.
VMware Tools must be installed in order to enable ballooning. This is recommended for all workloads. It has no external interfaces to the guest operating system and communicates with the hypervisor through a private channel. The balloon driver polls the hypervisor to obtain a target balloon size. If the hypervisor needs to reclaim virtual machine memory, it sets a proper target balloon size for the balloon driver, making it “inflate” by allocating guest physical pages within the virtual machine. The figure below illustrates the process of the balloon inflating

In the figure below, four guest physical pages are mapped in the host physical memory. Two of the pages are used by the guest application and the other two pages (marked by stars) are in the guest operating system free list. Note that since the hypervisor cannot identify the two pages in the guest free list, it cannot reclaim the host physical pages that are backing them. Assuming the hypervisor needs to reclaim two pages from the virtual machine, it will set the target balloon size to two pages. After obtaining the target balloon size, the balloon driver allocates two guest physical pages inside the virtual machine and pins them, as shown in Figure b. Here, “pinning” is achieved through the guest operating system interface, which ensures that the pinned pages cannot be paged out to disk under any circumstances. Once the memory is allocated, the balloon driver notifies the hypervisor about the page numbers of the pinned guest physical memory so that the hypervisor can reclaim the host physical pages that are backing them. In Figure b, dashed arrows point at these pages. The hypervisor can safely reclaim this host physical memory because neither the balloon driver nor the guest operating system relies on the contents of these pages. This means that no processes in the virtual machine will intentionally access those pages to read/write any values. Thus, the hypervisor does not need to allocate host physical memory to store the page contents. If any of these pages are re-accessed by the virtual machine for some reason, the hypervisor will treat it as a normal virtual machine memory allocation and allocate a new host physical page for the virtual machine. When the hypervisor decides to deflate the balloon—by setting a smaller target balloon size—the balloon driver deallocates the pinned guest physical memory, which releases it for the guest’s applications.


Typically, the hypervisor inflates the virtual machine balloon when it is under memory pressure. By inflating the balloon, a virtual machine consumes less physical memory on the host, but more physical memory inside the guest. As a result, the hypervisor offloads some of its memory overload to the guest operating system while slightly loading the virtual machine. That is, the hypervisor transfers the memory pressure from the host to the virtual machine. Ballooning induces guest memory pressure. In response, the balloon driver allocates and pins guest physical memory. The guest operating system determines if it needs to page out guest physical memory to satisfy the balloon driver’s allocation requests. If the virtual machine has plenty of free guest physical memory, inflating the balloon will induce no paging and will not impact guest performance. In this case, as illustrated in the figure, the balloon driver allocates the free guest physical memory from the guest free list. Hence, guest-level paging is not necessary. However, if the guest is already under memory pressure, the guest operating system decides which guest physical pages to be paged out to the virtual swap device in order to satisfy the balloon driver’s allocation requests. The genius of ballooning is that it allows the guest operating system to intelligently make the hard decision about which pages to be paged out without the hypervisor’s involvement.

Hypervisor/Host Swapping

In the cases where ballooning and transparent page sharing are not sufficient to reclaim memory, ESX employs hypervisor swapping to reclaim memory. At virtual machine startup, the hypervisor creates a separate swap file for the virtual machine. Then, if necessary, the hypervisor can directly swap out guest physical memory to the swap file, which frees host physical memory for other virtual machines.
Besides the limitation on the reclaimed memory size, both page sharing and ballooning take time to reclaim memory. The page-sharing speed depends on the page scan rate and the sharing opportunity. Ballooning speed relies on the guest operating system’s response time for memory allocation.
In contrast, hypervisor swapping is a guaranteed technique to reclaim a specific amount of memory within a specific amount of time. However, hypervisor swapping is used as a last resort to reclaim memory from the virtual machine due to the following limitations on performance:

  • Page selection problems: Under certain circumstances, hypervisor swapping may severely penalize guest performance. This occurs when the hypervisor has no knowledge about which guest physical pages should be swapped out, and the swapping may cause unintended interactions with the native memory management policies in the guest operating system.
  • Double paging problems: Another known issue is the double paging problem. Assuming the hypervisor swaps out a guest physical page, it is possible that the guest operating system pages out the same physical page, if the guest is also under memory pressure. This causes the page to be swapped in from the hypervisor swap device and immediately to be paged out to the virtual machine’s virtual swap device.

Page selection and double-paging problems exist because the information needed to avoid them is not available to the hypervisor.

  • High swap-in latency: Swapping in pages is expensive for a VM. If the hypervisor swaps out a guest page and the guest subsequently accesses that page, the VM will get blocked until the page is swapped in from disk. High swap-in latency, which can be tens of milliseconds, can severely degrade guest performance.

ESX mitigates the impact of interacting with guest operating system memory management by randomly selecting the swapped guest physical pages.

Memory Compression

The idea of memory compression is very straightforward: if the swapped out pages can be compressed and stored in a compression cache located in the main memory, the next access to the page only causes a page decompression which can be an order of magnitude faster than the disk access. With memory compression, only a few uncompressible pages need to be swapped out if the compression cache is not full. This means the number of future synchronous swap-in operations will be reduced. Hence, it may improve application performance significantly when the host is in heavy memory pressure. In ESX 4.1, only the swap candidate pages will be compressed. This means ESX will not proactively compress guest pages when host swapping is not necessary. In other words, memory compression does not affect workload performance when host memory is undercommitted.

Reclaiming Memory through Compression

Figure a,b and c illustrates how memory compression reclaims host memory compared to host swapping. Assuming ESX needs to reclaim two 4KB physical pages from a VM through host swapping, page A and B are the selected pages (Figure a,b,c). With host swapping only, these two pages will be directly swapped to disk and two physical pages are reclaimed (Figure b). However, with memory compression, each swap candidate page will be compressed and stored using 2KB of space in a per-VM compression cache. Note that page compression would be much faster than the normal page swap out operation which involves a disk I/O. Page compression will fail if the compression ratio is less than 50% and the uncompressible pages will be swapped out. As a result, every successful page compression is accounted for reclaiming 2KB of physical memory. As illustrated in Figure c, pages A and B are compressed and stored as half-pages in the compression cache. Although both pages are removed from VM guest memory, the actual reclaimed memory size is one page.

If any of the subsequent memory access misses in the VM guest memory, the compression cache will be checked first using the host physical page number. If the page is found in the compression cache, it will be decompressed and push back to the guest memory. This page is then removed from the compression cache. Otherwise, the memory request is sent to the host swap device and the VM is blocked.

Managing Per-VM Compression Cache

The per-VM compression cache is accounted for by the VM’s guest memory usage, which means ESX will not allocate additional host physical memory to store the compressed pages. The compression cache is transparent to the guest OS. Its size starts with zero when host memory is undercommitted and grows when virtual machine memory starts to be swapped out.
If the compression cache is full, one compressed page must be replaced in order to make room for a new compressed page. An age-based replacement policy is used to choose the target page. The target page will be decompressed and swapped out. ESX will not swap out compressed pages.
If the pages belonging to compression cache need to be swapped out under severe memory pressure, the compression cache size is reduced and the affected compressed pages are decompressed and swapped out.
The maximum compression cache size is important for maintaining good VM performance. If the upper bound is too small, a lot of replaced compressed pages must be decompressed and swapped out. Any following swap-ins of those pages will hurt VM performance. However, since compression cache is accounted for by the VM’s guest memory usage, a very large compression cache may waste VM memory and unnecessarily create VM memory pressure especially when most compressed pages would not be touched in the future. In ESX 4.1, the default maximum compression cache size is conservatively set to 10% of configured VM memory size. This value can be changed through the vSphere Client in Advanced Settings by changing the value for Mem.MemZipMaxPct.

When to reclaim Memory

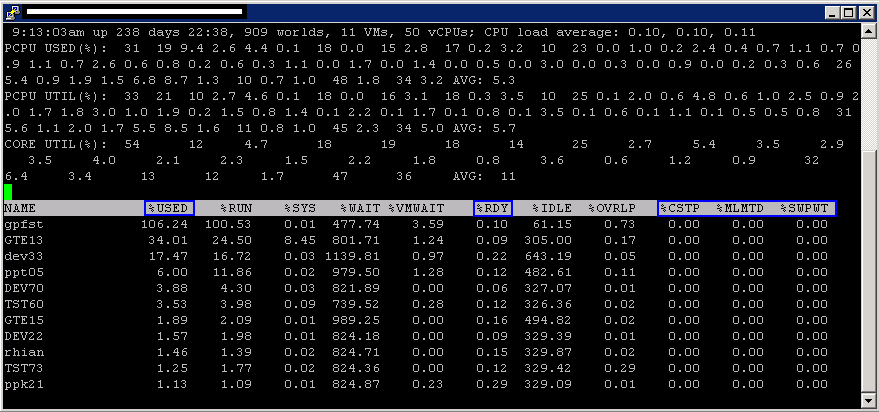
ESX maintains four host free memory states: high, soft, hard, and low, which are reflected by four thresholds: 6%, 4%, 2%, and 1% of host memory respectively. Figure 8 shows how the host free memory state is reported in esxtop.
By default, ESX enables page sharing since it opportunistically “frees” host memory with little overhead. When to use ballooning or swapping (which activates memory compression) to reclaim host memory is largely determined by the current host free memory state.

In the high state, the aggregate virtual machine guest memory usage is smaller than the host memory size. Whether or not host memory is overcommitted, the hypervisor will not reclaim memory through ballooning or swapping. (This is true only when the virtual machine memory limit is not set.)
If host free memory drops towards the soft threshold, the hypervisor starts to reclaim memory using ballooning. Ballooning happens before free memory actually reaches the soft threshold because it takes time for the balloon driver to allocate and pin guest physical memory. Usually, the balloon driver is able to reclaim memory in a timely fashion so that the host free memory stays above the soft threshold.
If ballooning is not sufficient to reclaim memory or the host free memory drops towards the hard threshold, the hypervisor starts to use swapping in addition to using ballooning. During swapping, memory compression is activated as well. With host swapping and memory compression, the hypervisor should be able to quickly reclaim memory and bring the host memory state back to the soft state.
In a rare case where host free memory drops below the low threshold, the hypervisor continues to reclaim memory through swapping and memory compression, and additionally blocks the execution of all virtual machines that consume more memory than their target memory allocations.
In certain scenarios, host memory reclamation happens regardless of the current host free memory state. For example, even if host free memory is in the high state, memory reclamation is still mandatory when a virtual machine’s memory usage exceeds its specified memory limit. If this happens, the hypervisor will employ ballooning and, if necessary, swapping and memory compression to reclaim memory from the virtual machine until the virtual machine’s host memory usage falls back to its specified limit

VMware vSphere 5 Memory Management and Monitoring diagram

The diagram from this KB is fantastic for showing the interoperability between Memory Management Techniques

KB2017642

Restarting VMware agents

Restarting the Management Agents

Caution: Restarting the management agents may impact any tasks that may be running on the ESX or ESXi host at the time of the restart

To restart the management agents on ESXi:

  1. Connect to the console of your ESXi host.
  2. Press F2 to customize the system.
  3. Login as root
  4. Use the Up/Down arrows to navigate to Restart Management Agents.Note: In ESXi 4.1 and ESXi 5.0, this option is available under Troubleshooting Options.
  5. Press Enter.
  6. Press F11 to restart the services.
  7. When the service has been restarted, press Enter.
  8. Press Esc to log out of the system.

Restarting the Management Network

To restart the management network on ESXi:

  1. Connect to the console of your ESXi host.
  2. Press F2 to customize the system.
  3. Login as root
  4. Use the Up/Down arrows to navigate to Restart Management Network

To restart the management agents on ESX host:

  1. Log in to your ESX host as root from either an SSH session or directly from the console.
  2. Run this command

service mgmt-vmware restart

To restart the management agents on ESXi host:

  1. Log in to your ESX host as root from either an SSH session or directly from the console.
  2. Run this command

/sbin/services.sh restart

To restart the Hostd on the ESXi host

  1. Log in to your ESX host as root from either an SSH session or directly from the console.
  2. Run this command

/etc/init.d/hostd restart

VMware Netflow Monitoring

What is Netflow?

It’s a Cisco protocol that was developed for analysing network traffic. It has become an industry standard spec for collecting types of network data for monitoring and reporting. Data sources being switches and routers etc

  • A network Analysis Tool for monitoring the network and for gaining visibility into VM Traffic
  • A tool that can be used for profiling, intrusion detection, networking forensics and compliance
  • Supported on Distributed Virtual Switches in vSphere 5
  • Sarbanes Oxley compliance
  • Not really for packet sniffing,more for profiling the top 10 network flows etc

How is it implemented?

It is implemented in vSphere 5 dvSwitches

What types of flow does Netflow capture?

  • Internal Flow. Represents intrahost virtual machine traffic. Traffic between VM’s on the same host
  • External Flow. Represents interhost virtual machine traffic and physical machine to virtual machine traffic. Traffic between VM’s on different hosts or VM’s on different switches

What is a flow?

A flow is a sequence of packets that share the same 7 properties

  1. Source IP Address
  2. Destination IP Address
  3. Source Port
  4. Destination Port
  5. Input Interface ID
  6. Output interface ID
  7. Protocol

Flows

A flow is unidirectional. Flows are processed and stored as flow records by supported network devices such as dvSwitches. The flow records are then sent to a NetFlow Collector for additional analysis.

Although efficient, NetFlow can put an additional strain on your network or the dvSwitch as it requires extra processing and additional storage on the host for the flow records to be processed and exported.

Third Party NetFlow Collectors – What do they do?

Third Party vendors have NetFlow Collector Products which can include the following features

  • Accepts and stores network flow records
  • Includes a storage system for long term storage on flow based data
  • Mines, aggregates and reports on the collected data
  • Customised user interface (Web based usually)

Reporting

The Netflow Collector reports on various kinds of networking information including

  1. Top network or bandwidth flows
  2. The IP Addresses which are behaving irregularly
  3. The number of bytes a VM has sent and received in the past 24 hours
  4. Unexpected application traffic

Configuring Netflow

  1. Go to Networking Inventory View
  2. Select dvSwitch and Edit Settings
  3. Click Netflow tab to see the box above

Description of options

  • Collector IP Address and Port

The IP Address and Port number used to communicate with the Netflow collector system. These fields must be set for Netflow Monitoring to be enabled for the dvSwitch or for any port or port group on the dvSwitch

  • VDS IP Address

An optional IP Address which is used to identify the source of the network flow to the NetFlow collector. The IP Address is not associated with a network port and it does not need to be pingable. This IP Address is used to fill the Source IP of the NetFlow packets. This IP Address allows the Netflow collector to interact with the dvSwitch as a single switch, rather than seeing a separate unrelated switch for each associated host. If this is not configured, the hosts management address is used instead.

  • Active flow export timeout

The number of seconds after which active flows (flows where packets are sent) are forced to be exported to the NetFlow collector. The default is 300 and can range from 0-3600

  • Idle flow export timeout

The The number of seconds after which idle flows (flows where no packets have been seen for x number of seconds) are forced to be exported to the collector.The default is 15 and can range from 0-300

  • Sampling Rate

The value that is used to determine what portion of data that Netflow collects. If the sampling rate is 2, it collects every other packet. If the rate is 5, the data is collected form every 5th packet. 0 counts every packet

  • Process internal flows only

Indicates whether to limit analysis to traffic that has both the source and destination virtual machine on the same host. By default the checkbox is not selected which means internal and external flows are processed. You might select this checkbox if you already have NetFlow deployed in your datacenter and you want to only see the floes that cannot be seen by your existing NetFlow collector.

After configuring Netflow on the dvSwitch, you can then enable NetFlow monitoring on a distributed Port Group or an uplink.